
📊 PAXG/USDT Market Analysis – Gold Shows Bullish Momentum! Is a Breakout Coming?
Date: November 14, 2026
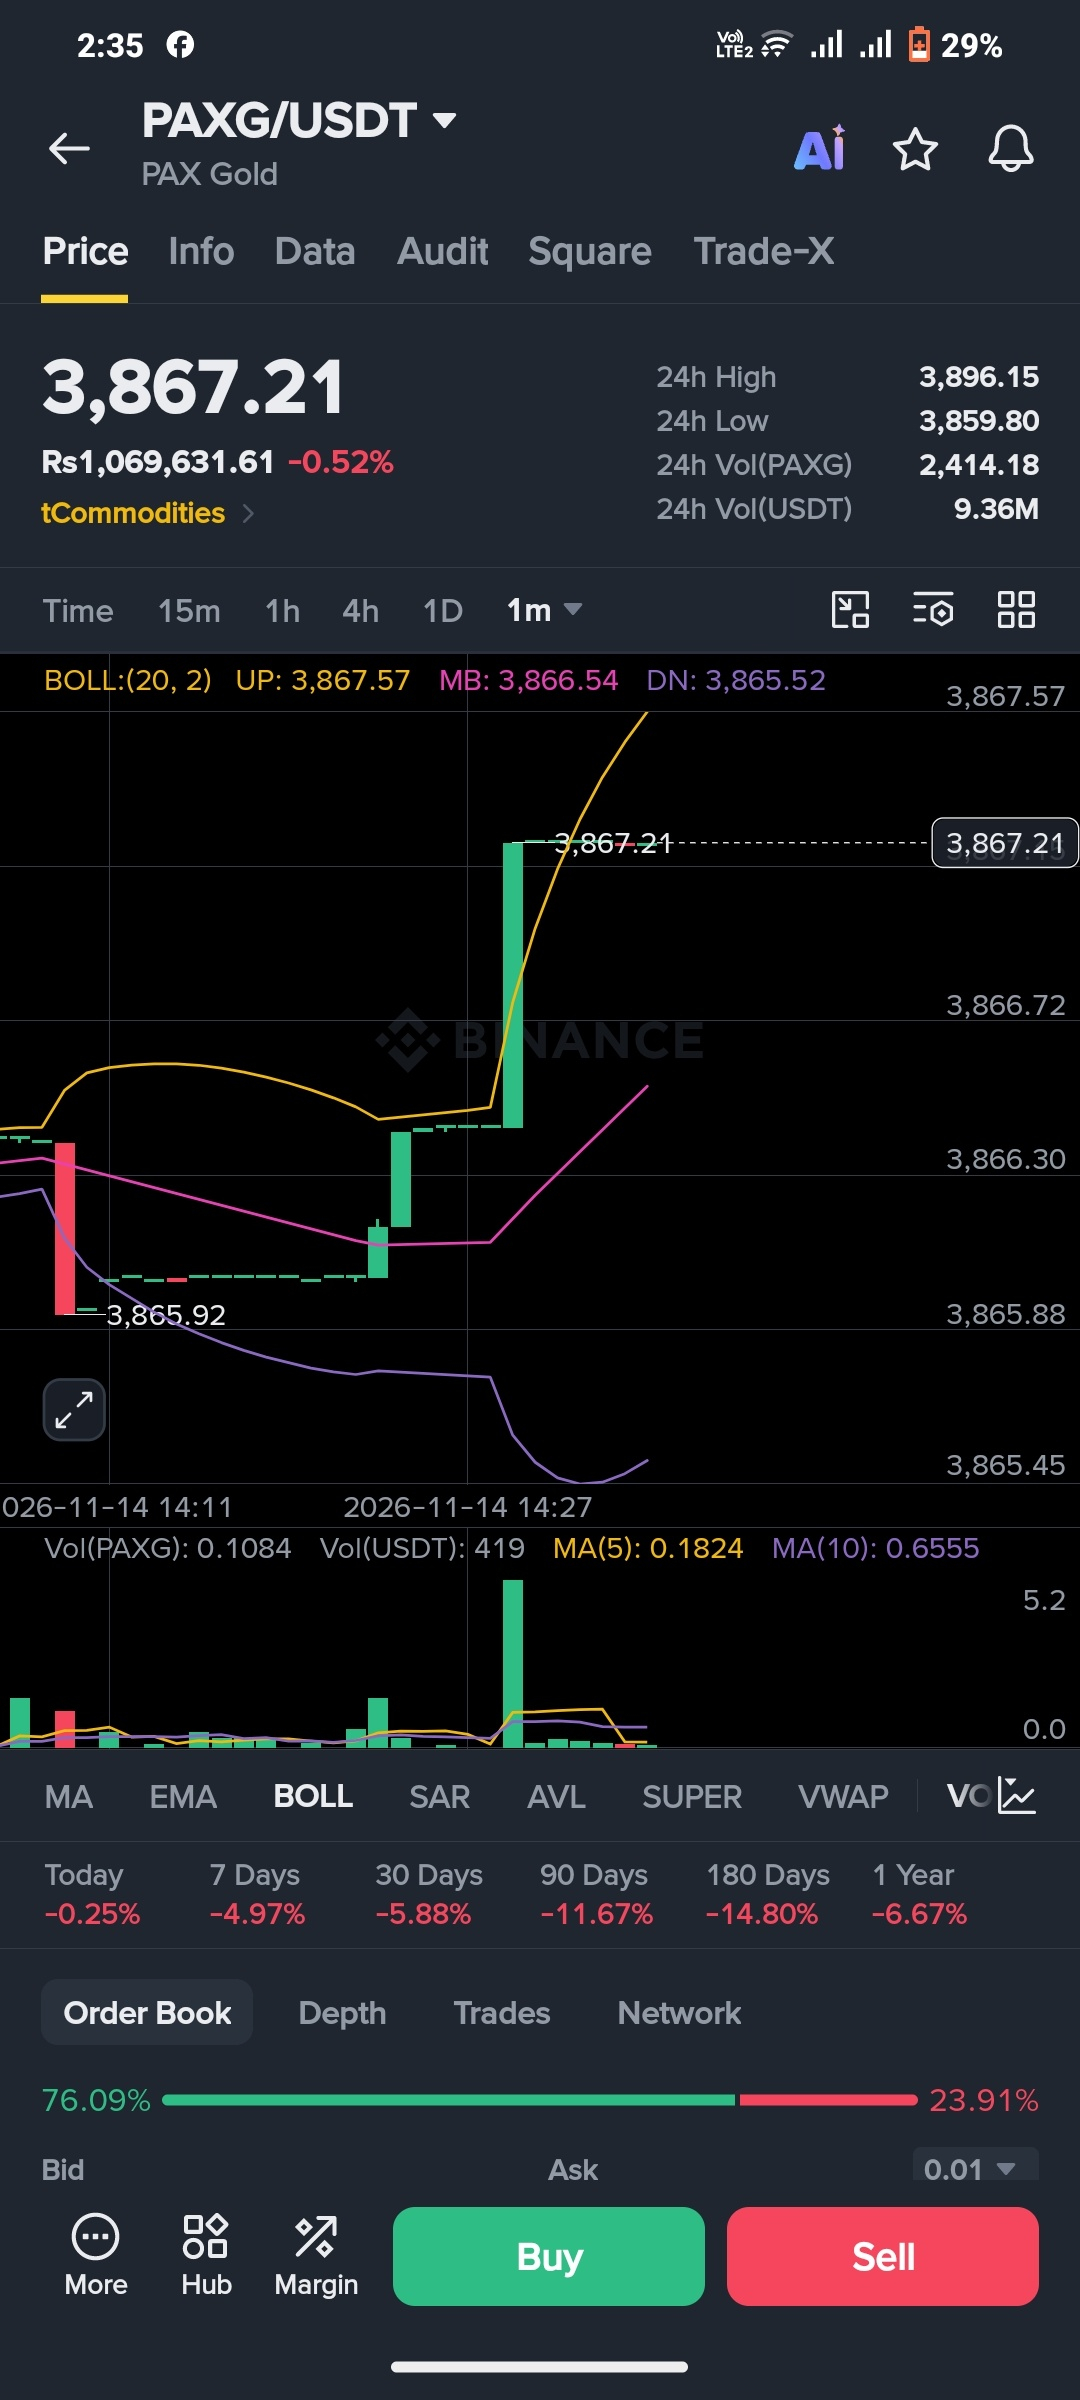
The PAXG/USDT market is showing noticeable bullish momentum on the 1-minute timeframe. According to the provided chart, PAX Gold is currently trading at 3,867.21 USDT, with a 24-hour high of 3,896.15 and a low of 3,859.80.
📈 Technical Analysis
The chart shows a strong recovery from approximately 3,865.92, followed by consecutive green candles pushing the price toward 3,867.21.
Bollinger Bands Analysis:
Upper Band: 3,867.57
Middle Band: 3,866.54
Lower Band: 3,865.52
The price is currently trading close to the upper Bollinger Band, indicating short-term buying pressure and potential bullish momentum.
🎯 Key Support & Resistance Levels
Resistance Levels:
3,867.57
3,868.00
3,869.00
Support Levels:
3,866.54
3,865.92
3,865.52
🔍 What Could Happen Next?
If PAXG successfully breaks above 3,867.57 and maintains its position, further upward movement could become possible.
However, if the price faces rejection near this resistance, a short-term pullback toward 3,866.54 or 3,865.92 may occur.
⚠️ Trading Strategy & Risk Management
Bullish momentum is visible, but traders should avoid making decisions based on a single large green candle.$PAXG
Before entering any trade, consider:
Trading volume confirmation.
The next candle's closing position.
Trend direction on higher timeframes.
Proper stop-loss and risk management.
Final Thoughts:
PAXG/USDT is showing promising short-term bullish activity. However, confirmation above resistance will be important before expecting further upside.
Remember: Successful trading is not about chasing the market. It's about patience, discipline, proper analysis, and smart risk management.
#PAXG #PAXGUSDT #GoldTrading #CryptoAnalysis #TechnicalAnalysis #Binance #TradingSignals
Disclaimer: This analysis is based on the provided chart screenshot and is for educational purposes only. It is not financial advice. Always manage your risk before trading.$PAXG