
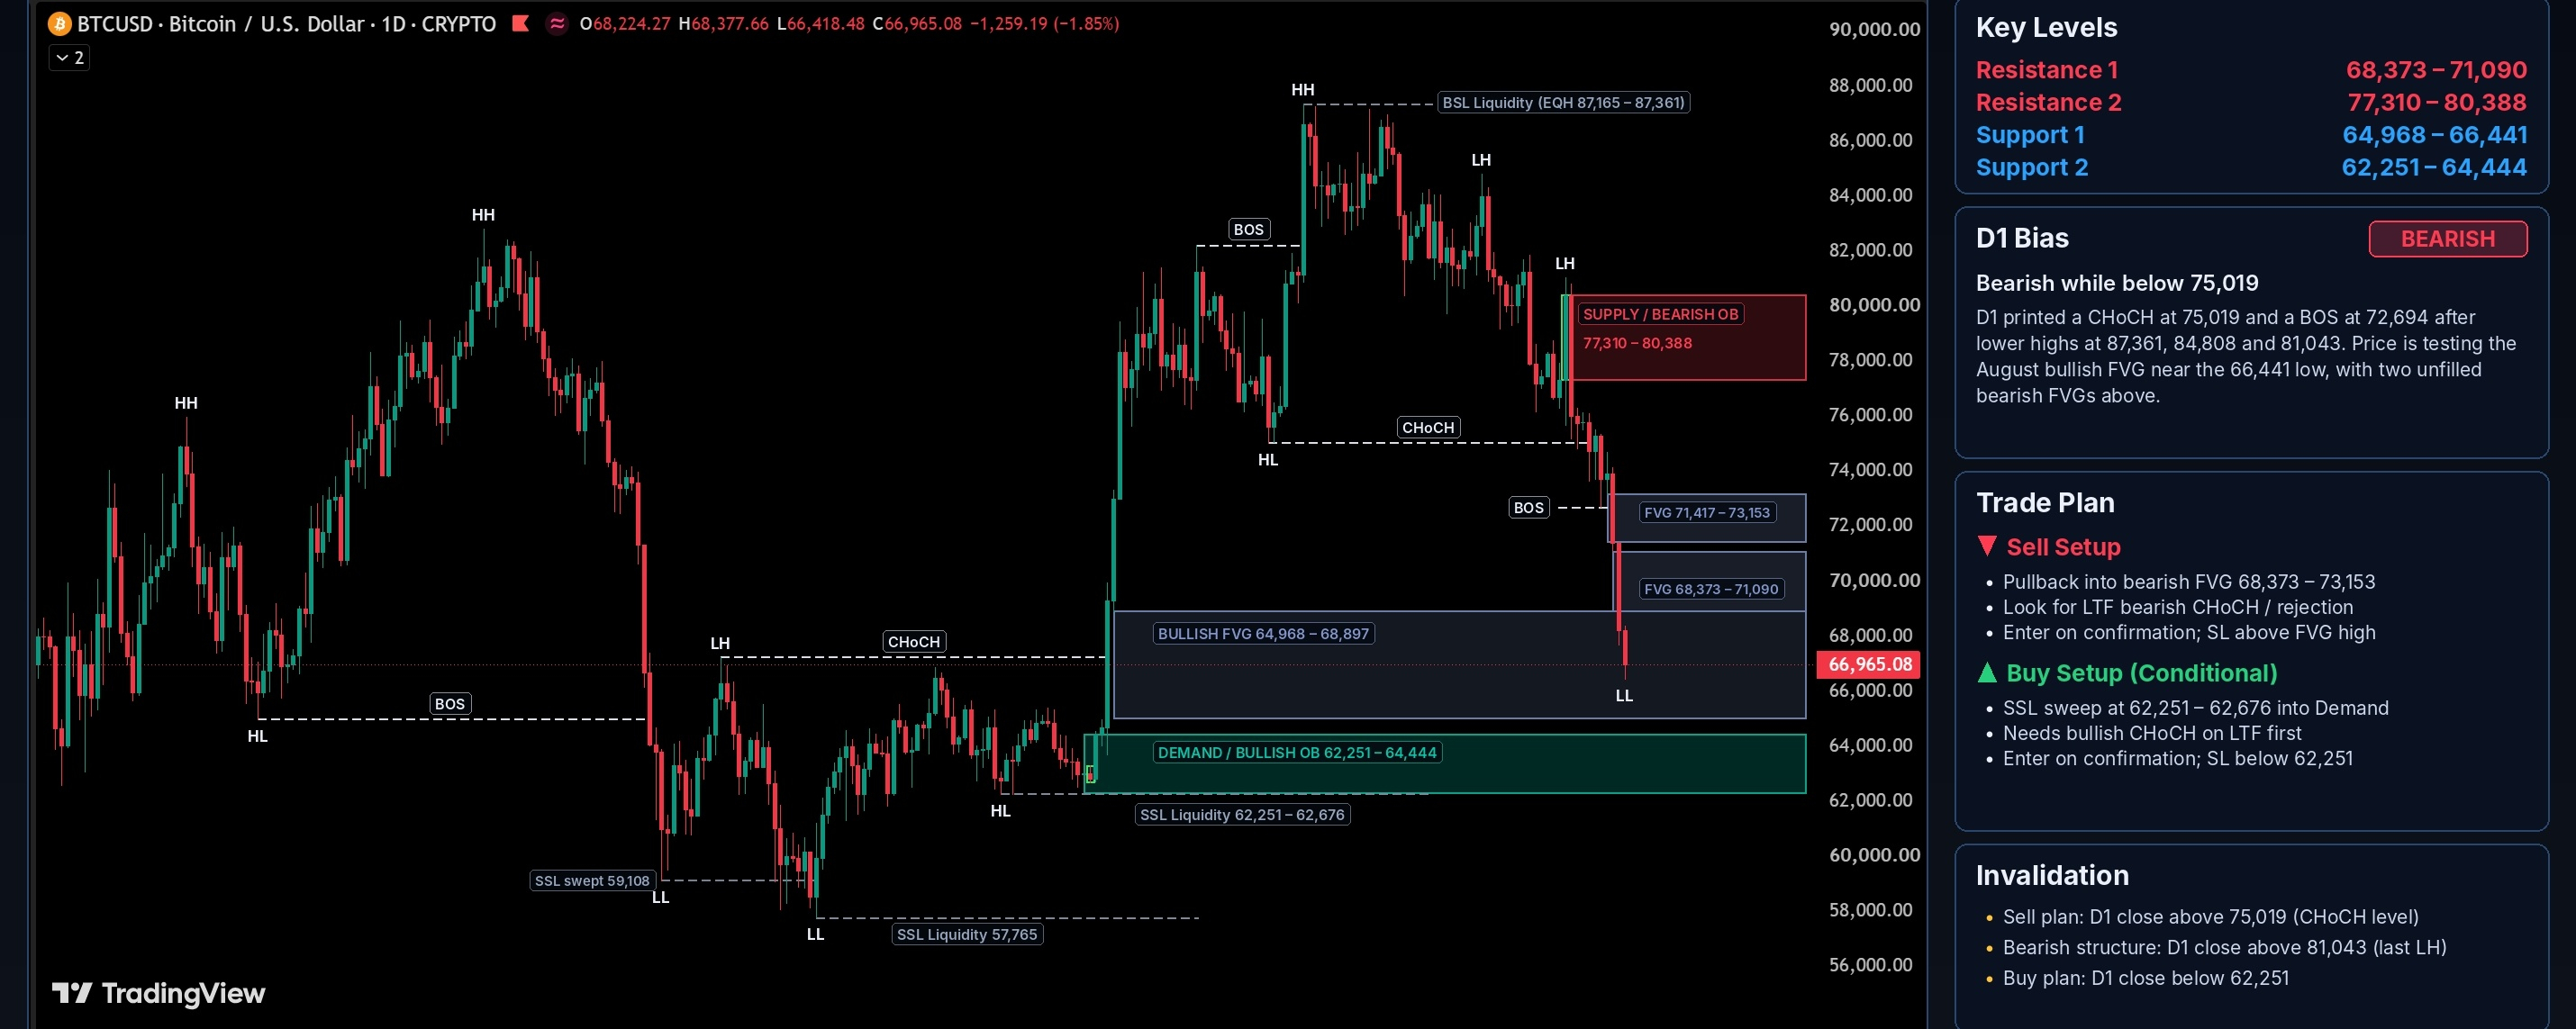

Overall bias: Bearish below 75,019
Market Structure
Mar–May: $BTC Had the Bullish structure. The April HL at 64,968 preceded the May HH at 82,810.
Jun: A bearish BOS below 64,968 produced a LL at 59,108 and a LH at 67,227.
Jul: The 57,765 low swept the sell-side liquidity at 59,108.
Aug: A base formed at 62,251–62,676. A bullish CHoCH above 67,227 followed, leaving a bullish FVG at 64,968–68,897.
Sep–Oct: A bullish BOS above 82,221 extended to the 87,361 HH. Equal highs at 87,165–87,361 form unswept BSL.
Nov: Lower highs at 84,808 and 81,043 preceded a bearish CHoCH at 75,019 and a bearish BOS at 72,694. The displacement left two unfilled bearish FVGs.
Key Zones
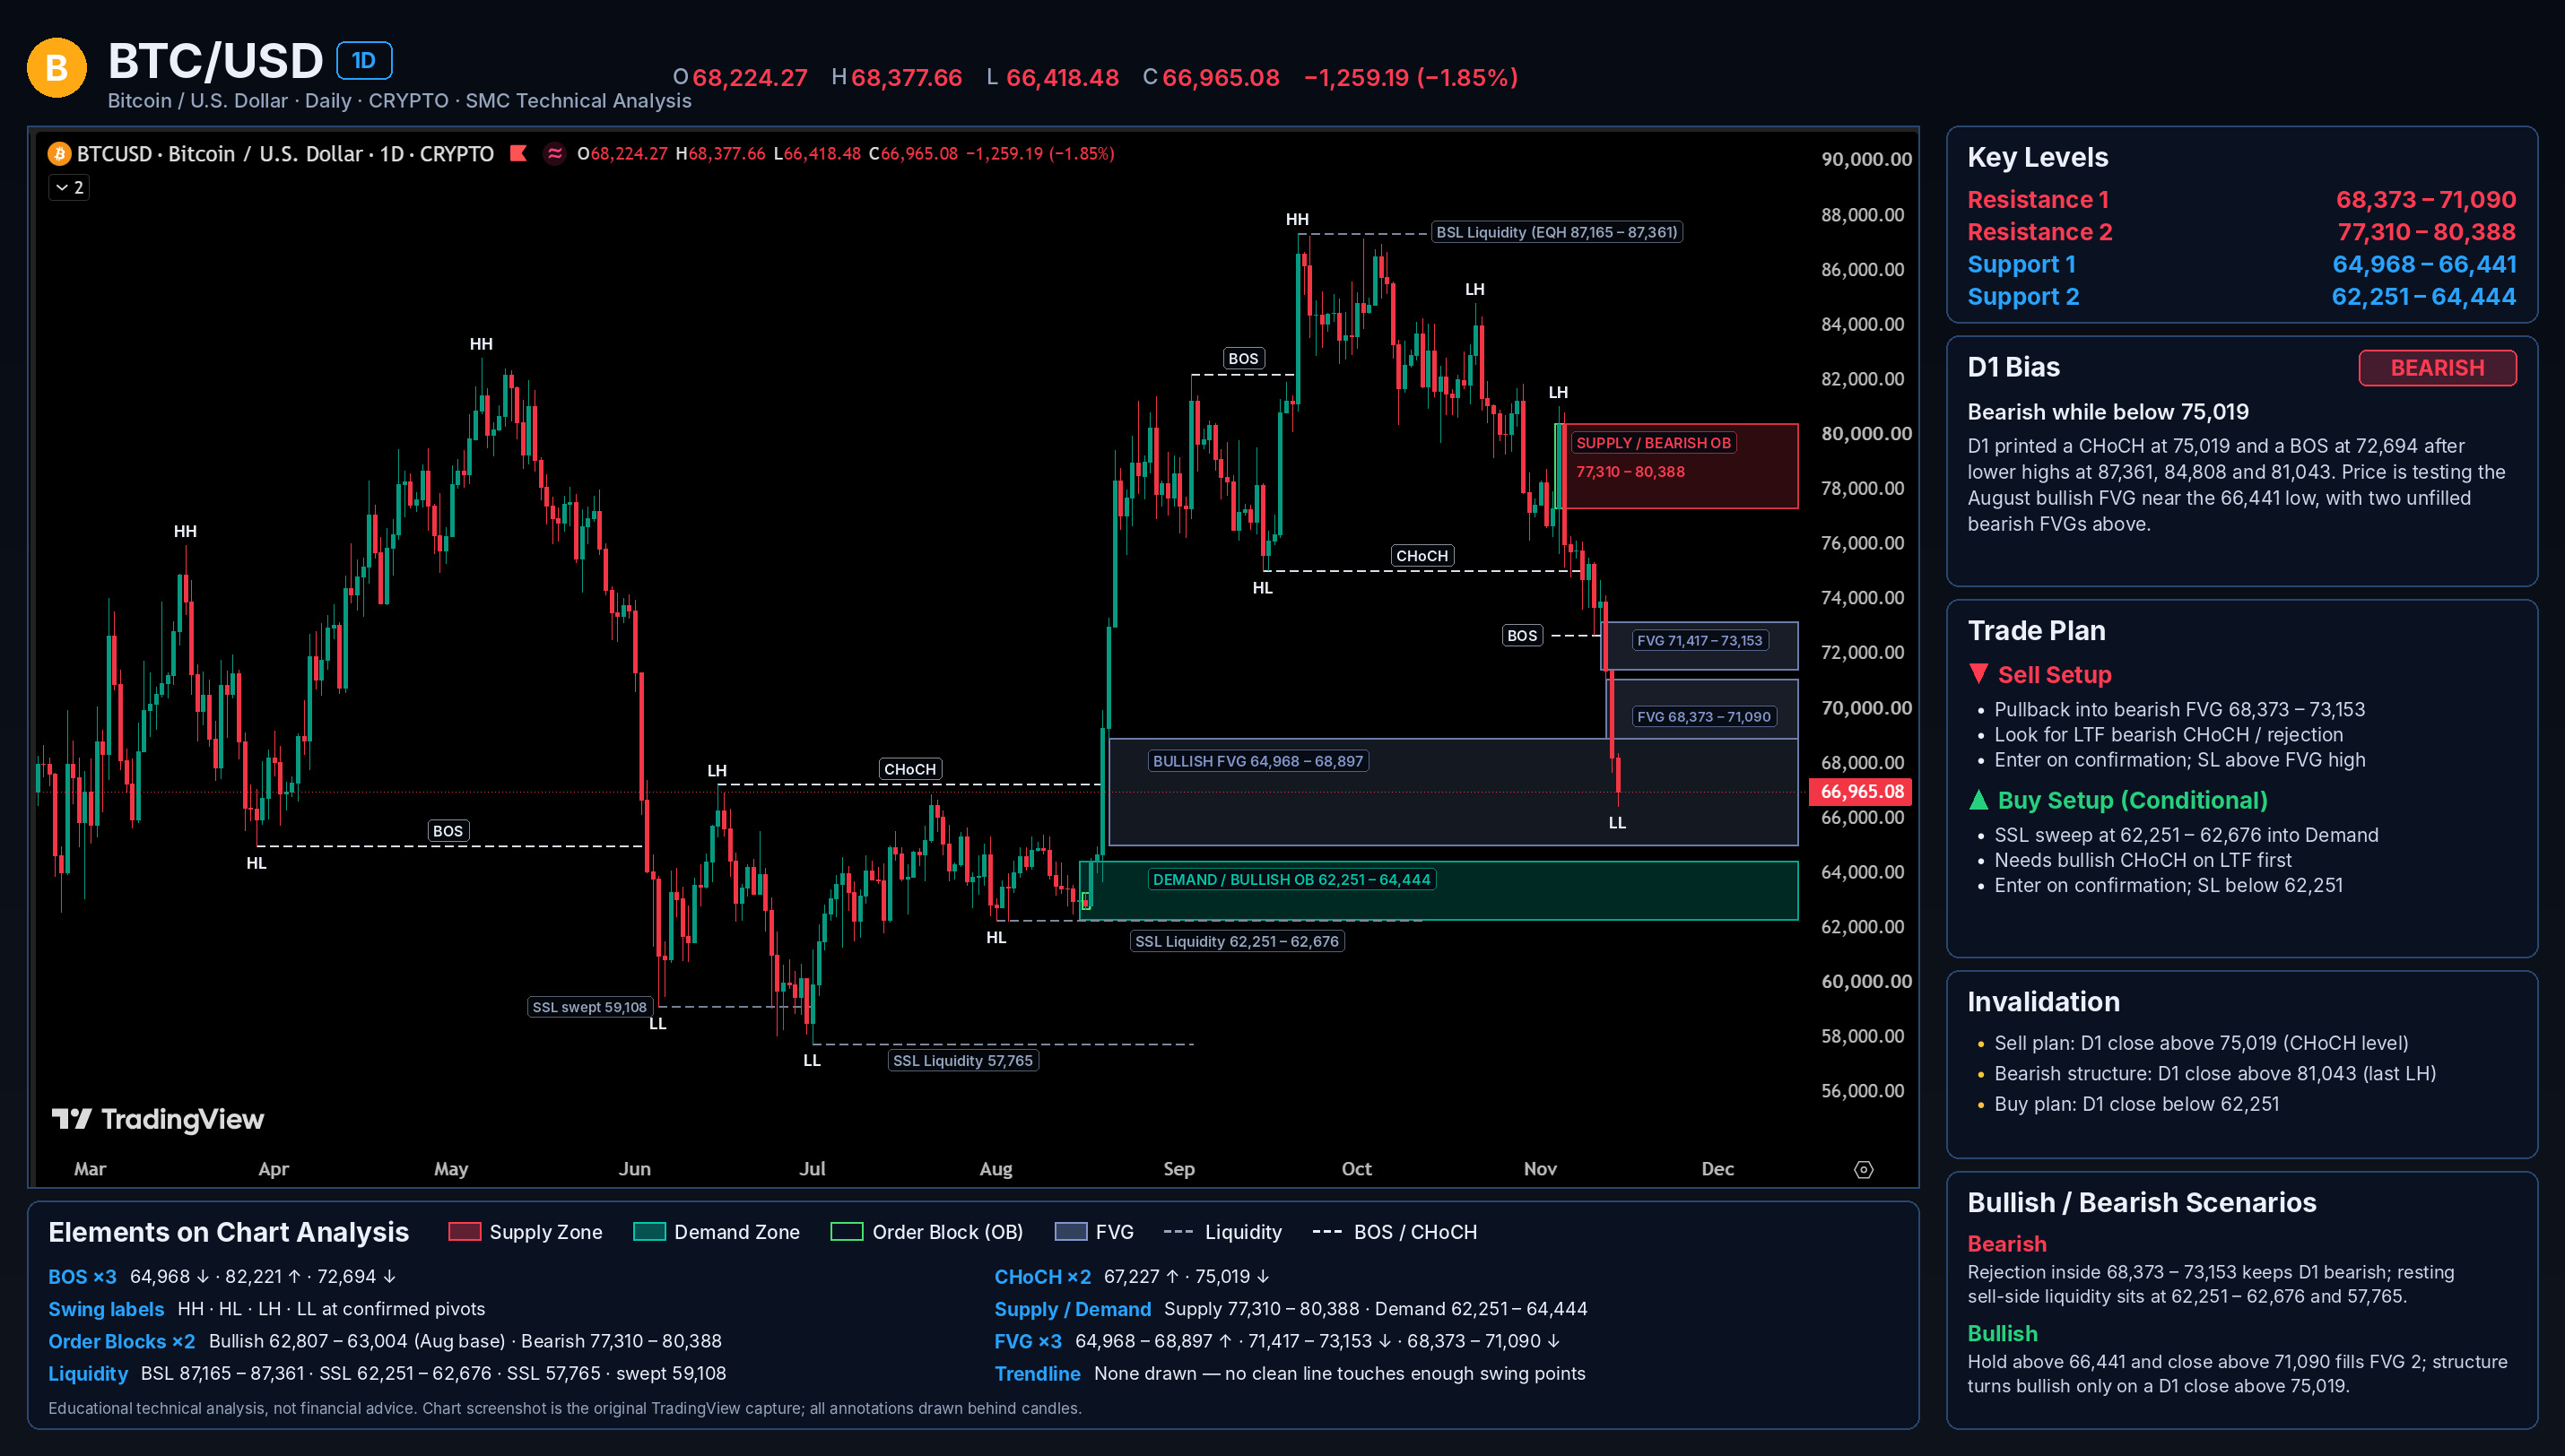
Supply / Bearish OB: 77,310 – 80,388
Origin of the bearish displacement. Unmitigated.
Bearish FVG 1: 71,417 – 73,153
Unfilled imbalance from the sell-off.
Bearish FVG 2: 68,373 – 71,090
Unfilled imbalance from the sell-off.
Bullish FVG: 64,968 – 68,897
August imbalance. Current price of 66,965 is trading inside it.
Demand / Bullish OB: 62,251 – 64,444
Origin of the August impulse.
Liquidity
SSL at 62,251–62,676 (equal lows)
SSL at 57,765
BSL at 87,165–87,361
Scenarios
Bearish: Rejection within 68,373–73,153 maintains the bearish daily structure. Sell-side liquidity at 62,251–62,676 and 57,765 lies below.
Bullish: A hold above 66,441 and a daily close above 71,090 fills FVG 2. The structure turns bullish on a daily close above 75,019.
Trade Framework (Conditional)
Sell: Pullback into 68,373–73,153 with a bearish CHoCH or rejection on a lower timeframe. Stop above the FVG high used.
Buy: Sweep of 62,251–62,676 into the demand zone with a bullish CHoCH on a lower timeframe. Stop below 62,251.
Invalidation
Sell plan: Daily close above 75,019.
Bearish structure: Daily close above 81,043.
Buy plan: Daily close below 62,251.