One red line. Two upside levels. This is why $BARD has my attention.
The most important number on my chart is $0.1135. That's where my bullish idea faces its real test.
The setup
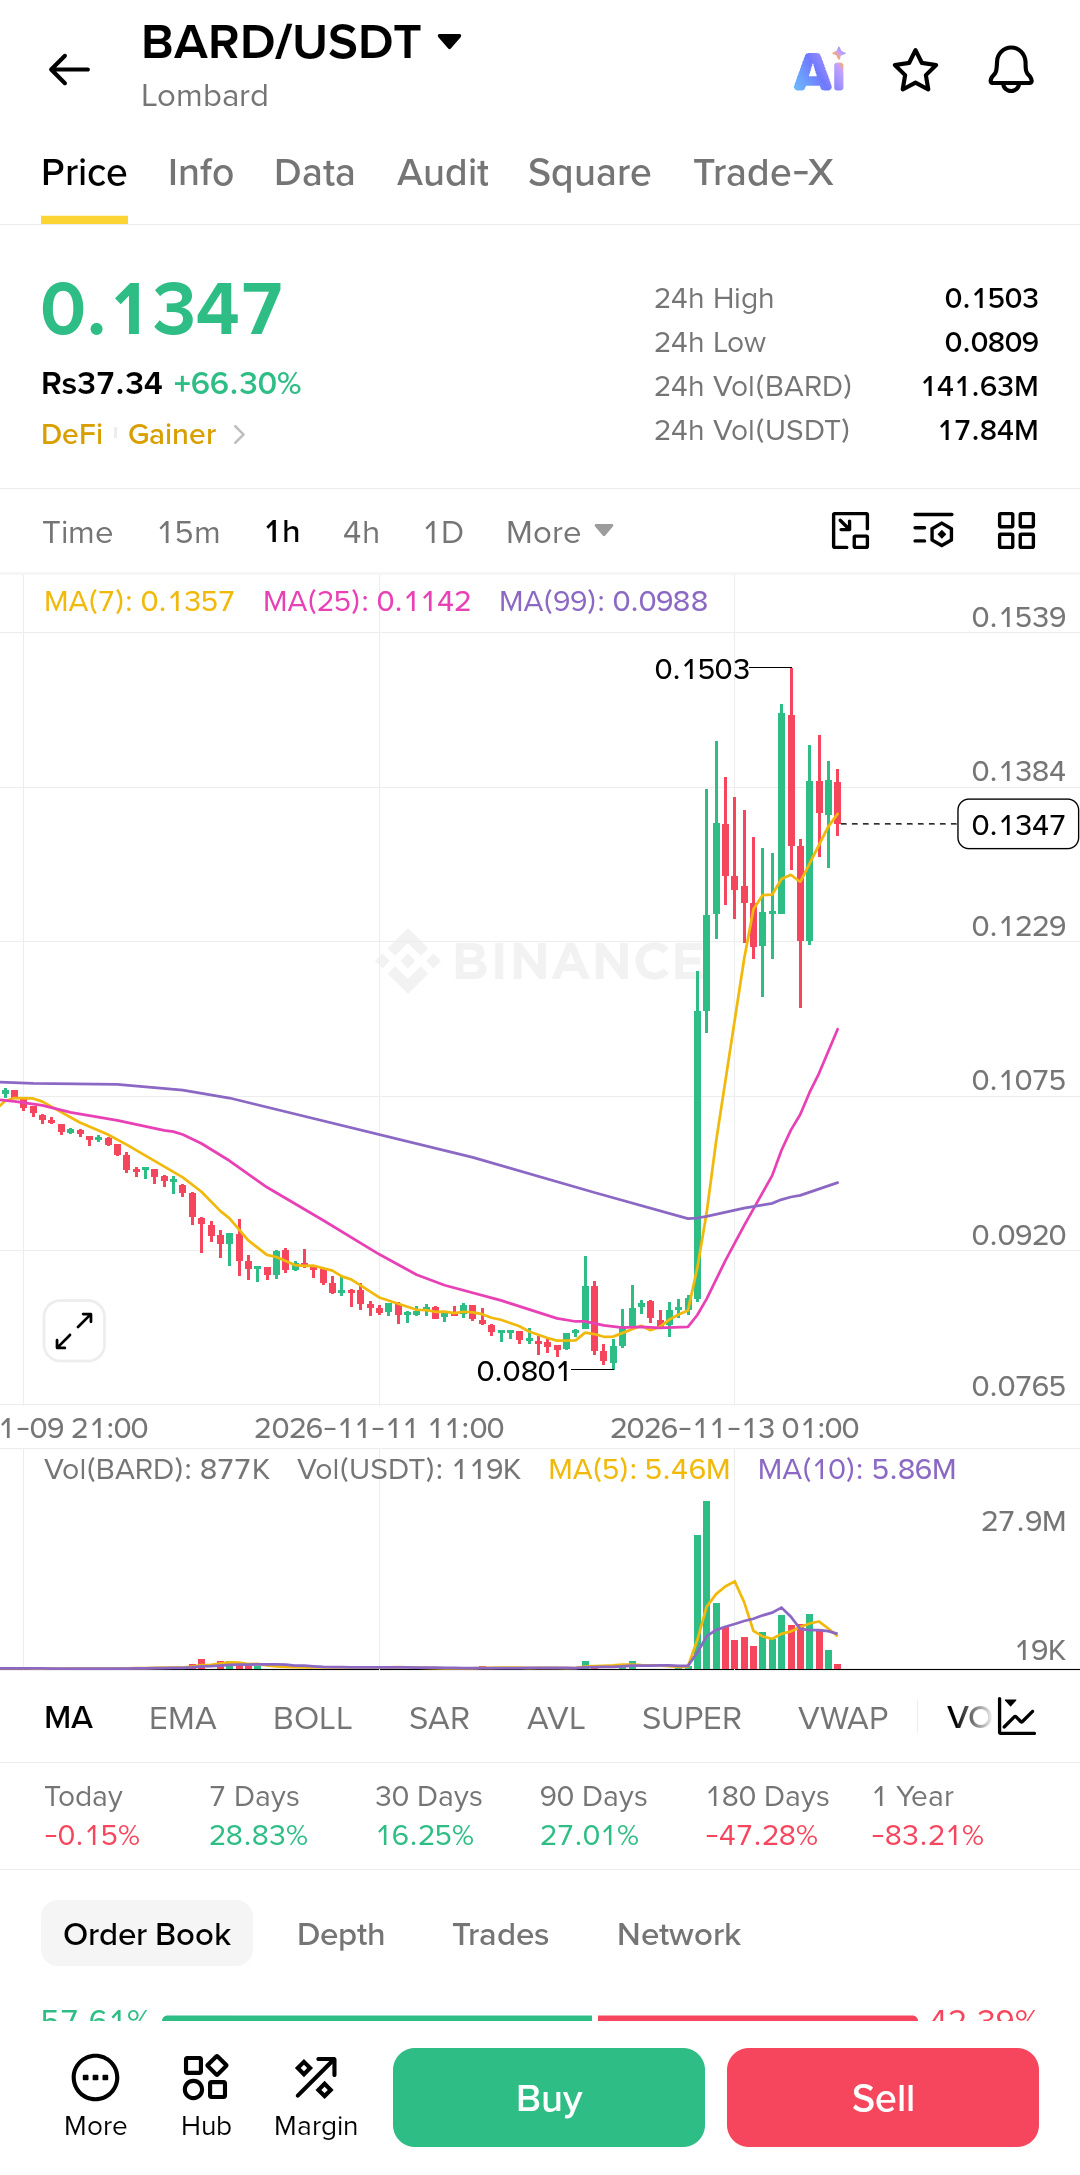
$BARD is trading near historical lows on the higher timeframes, down about 83% over the past year, even after today's bounce of about 66% to roughly $0.1347.
Weekly RSI analysis suggests a possible bullish divergence.
The daily chart has already shown an initial reaction, and price is now testing that base again.
What I want to see is buyers absorbing the selling pressure, followed by a clear shift in daily market structure.
If that happens with stronger volume, I'm watching two swing levels:
🎯 Target 1: ~$0.1503 (about +11.6% from $0.1347), the recent high
🎯 Target 2: ~$0.1700 (about +26% from $0.1347)
These are ambitious scenarios, not guaranteed returns.
Monday's reopening of traditional markets could bring fresh activity, but $BARD needs its own buying volume to support a meaningful recovery. Its relatively small market size also means sharp moves can happen in either direction, and a +66% day shows how fast it can go.
Management: If price breaks below $0.1135 and cannot recover that level, my bullish setup is no longer valid. For a new position, I want a confirmed daily higher low, a break above the latest lower high, and expanding volume. The protective stop belongs below the confirmed structure. Position size and the final risk-to-reward ratio must be calculated from the actual entry and stop, not assumed in advance. I'm heavily bullish on $BARD's recovery potential, but the next volume-backed move will determine whether this remains a promising chart or becomes a trade worth taking.
Not financial advice. Do your own research and manage your risk.
#HuangExitNvidiaStrategyInFocus
#TradFiForBeginners
#BinanceHerYerde
The most important number on my chart is $0.1135. That's where my bullish idea faces its real test.
The setup
$BARD is trading near historical lows on the higher timeframes, down about 83% over the past year, even after today's bounce of about 66% to roughly $0.1347.
Weekly RSI analysis suggests a possible bullish divergence.
The daily chart has already shown an initial reaction, and price is now testing that base again.
What I want to see is buyers absorbing the selling pressure, followed by a clear shift in daily market structure.
If that happens with stronger volume, I'm watching two swing levels:
🎯 Target 1: ~$0.1503 (about +11.6% from $0.1347), the recent high
🎯 Target 2: ~$0.1700 (about +26% from $0.1347)
These are ambitious scenarios, not guaranteed returns.
Monday's reopening of traditional markets could bring fresh activity, but $BARD needs its own buying volume to support a meaningful recovery. Its relatively small market size also means sharp moves can happen in either direction, and a +66% day shows how fast it can go.
Management: If price breaks below $0.1135 and cannot recover that level, my bullish setup is no longer valid. For a new position, I want a confirmed daily higher low, a break above the latest lower high, and expanding volume. The protective stop belongs below the confirmed structure. Position size and the final risk-to-reward ratio must be calculated from the actual entry and stop, not assumed in advance. I'm heavily bullish on $BARD's recovery potential, but the next volume-backed move will determine whether this remains a promising chart or becomes a trade worth taking.
Not financial advice. Do your own research and manage your risk.
#HuangExitNvidiaStrategyInFocus
#TradFiForBeginners
#BinanceHerYerde