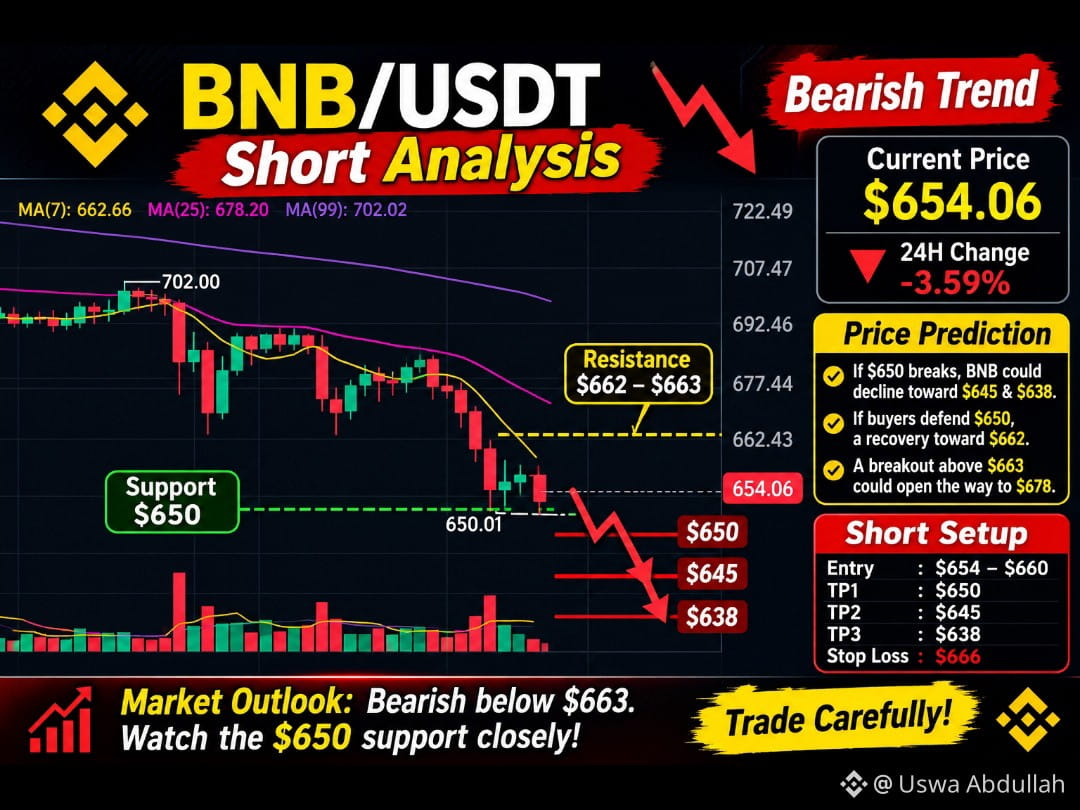
#BNBUSDT 🤔🤔🔥 – Short Market Analysis 📉👇👇
Current Price: $654.06 24H Change: -3.59%
$BNB is showing strong bearish momentum on the 4-hour chart. The price is trading below all three moving averages, indicating continued selling pressure.
Technical Analysis
* MA(7): $662.66
* MA(25): $678.20
* MA(99): $702.02
* Immediate support: $650
* Resistance: $662–$663
Price Prediction
* If $650 breaks, $BNB could decline toward $645 and $638.
* If buyers defend $650, a recovery toward $662 is possible.
* A breakout above $663 could open the way toward $678.
Trading Levels (Short Setup)
* Entry: $654–$660
* TP1: $650
* TP2: $645
* TP3: $638
* Stop Loss: $666
Market Outlook: Bearish below $663. Watch the $650 support closely for confirmation before entering a trade.
#BNB #BNBUSDT #CryptoAnalysis #PricePrediction #Binance #TradingSignals
Current Price: $654.06 24H Change: -3.59%
$BNB is showing strong bearish momentum on the 4-hour chart. The price is trading below all three moving averages, indicating continued selling pressure.
Technical Analysis
* MA(7): $662.66
* MA(25): $678.20
* MA(99): $702.02
* Immediate support: $650
* Resistance: $662–$663
Price Prediction
* If $650 breaks, $BNB could decline toward $645 and $638.
* If buyers defend $650, a recovery toward $662 is possible.
* A breakout above $663 could open the way toward $678.
Trading Levels (Short Setup)
* Entry: $654–$660
* TP1: $650
* TP2: $645
* TP3: $638
* Stop Loss: $666
Market Outlook: Bearish below $663. Watch the $650 support closely for confirmation before entering a trade.
#BNB #BNBUSDT #CryptoAnalysis #PricePrediction #Binance #TradingSignals