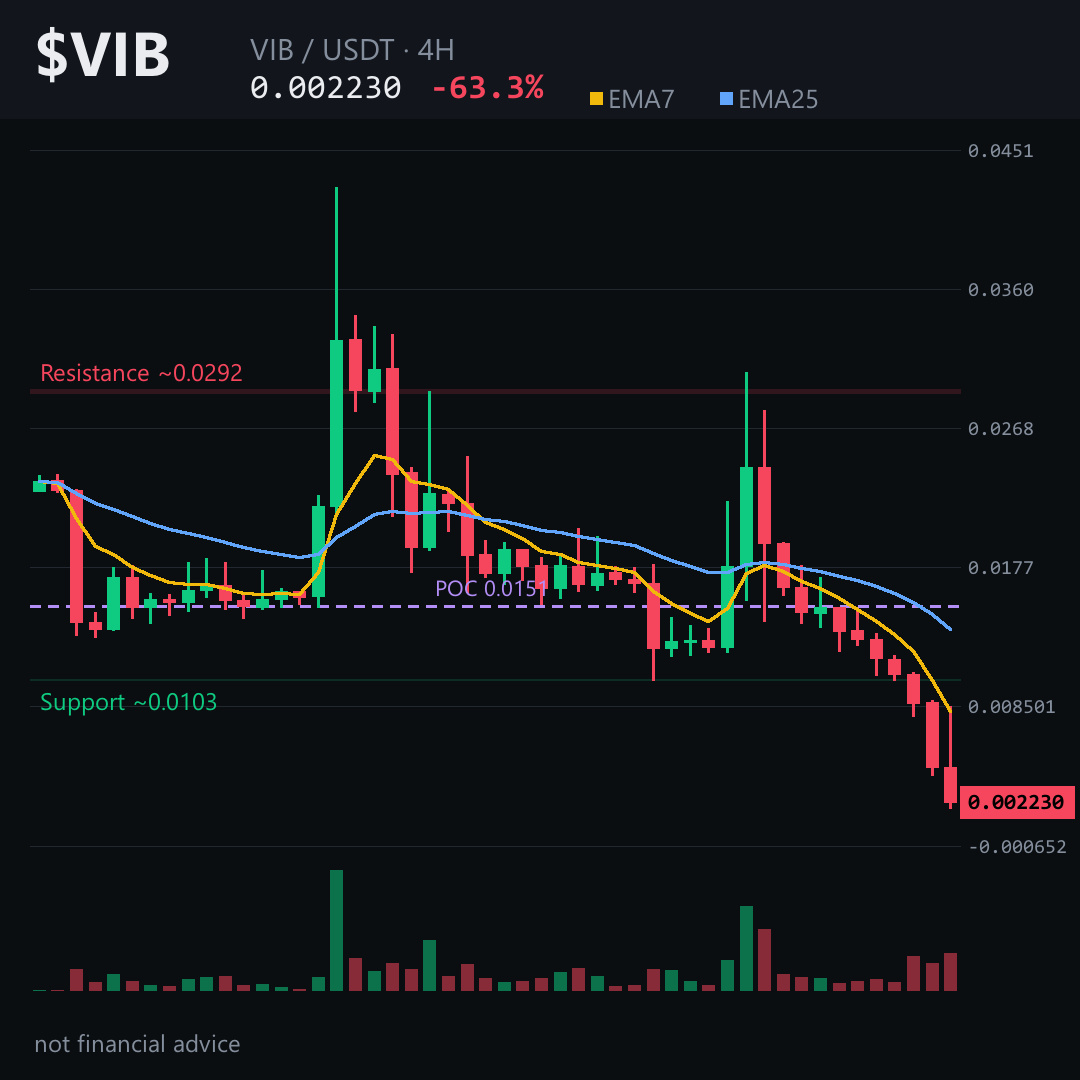
That 50% plunge from 0.007 to 0.0022 in 24 h left a bearish scar on the 4‑hour chart.
Here’s why the next move matters 👇
The 4H candles are screaming down: 10 reds vs 2 greens, EMA7 slipping under EMA25, and RSI stuck in the 20s. Yet a tiny unfilled bearish gap sits just above the current price, hinting the market could keep digging.
On the 4‑hour picture the price is hovering around the 0.00224 zone. If $VIB can’t hold above the 0.00235 ceiling, the bearish case stays alive and the next target slides toward the 0.00204 area. Lose the 0.00224 level on a 4H close and the read flips.
Tap $VIB to pull up the chart and verify the zones yourself.
My take: expect the bears to test the 0.00235 barrier; a break below the 0.00224 zone would reinforce the downtrend.
Follow me for the next update when the 0.00235 line either holds or gives way – I’ll break down what that means for the swing.
What level are you watching on $VIB’s chart right now? 👇
⚠️ Not financial advice. DYOR.
#VIB #Crypto #BinanceSquare
Here’s why the next move matters 👇
The 4H candles are screaming down: 10 reds vs 2 greens, EMA7 slipping under EMA25, and RSI stuck in the 20s. Yet a tiny unfilled bearish gap sits just above the current price, hinting the market could keep digging.
On the 4‑hour picture the price is hovering around the 0.00224 zone. If $VIB can’t hold above the 0.00235 ceiling, the bearish case stays alive and the next target slides toward the 0.00204 area. Lose the 0.00224 level on a 4H close and the read flips.
Tap $VIB to pull up the chart and verify the zones yourself.
My take: expect the bears to test the 0.00235 barrier; a break below the 0.00224 zone would reinforce the downtrend.
Follow me for the next update when the 0.00235 line either holds or gives way – I’ll break down what that means for the swing.
What level are you watching on $VIB’s chart right now? 👇
⚠️ Not financial advice. DYOR.
#VIB #Crypto #BinanceSquare