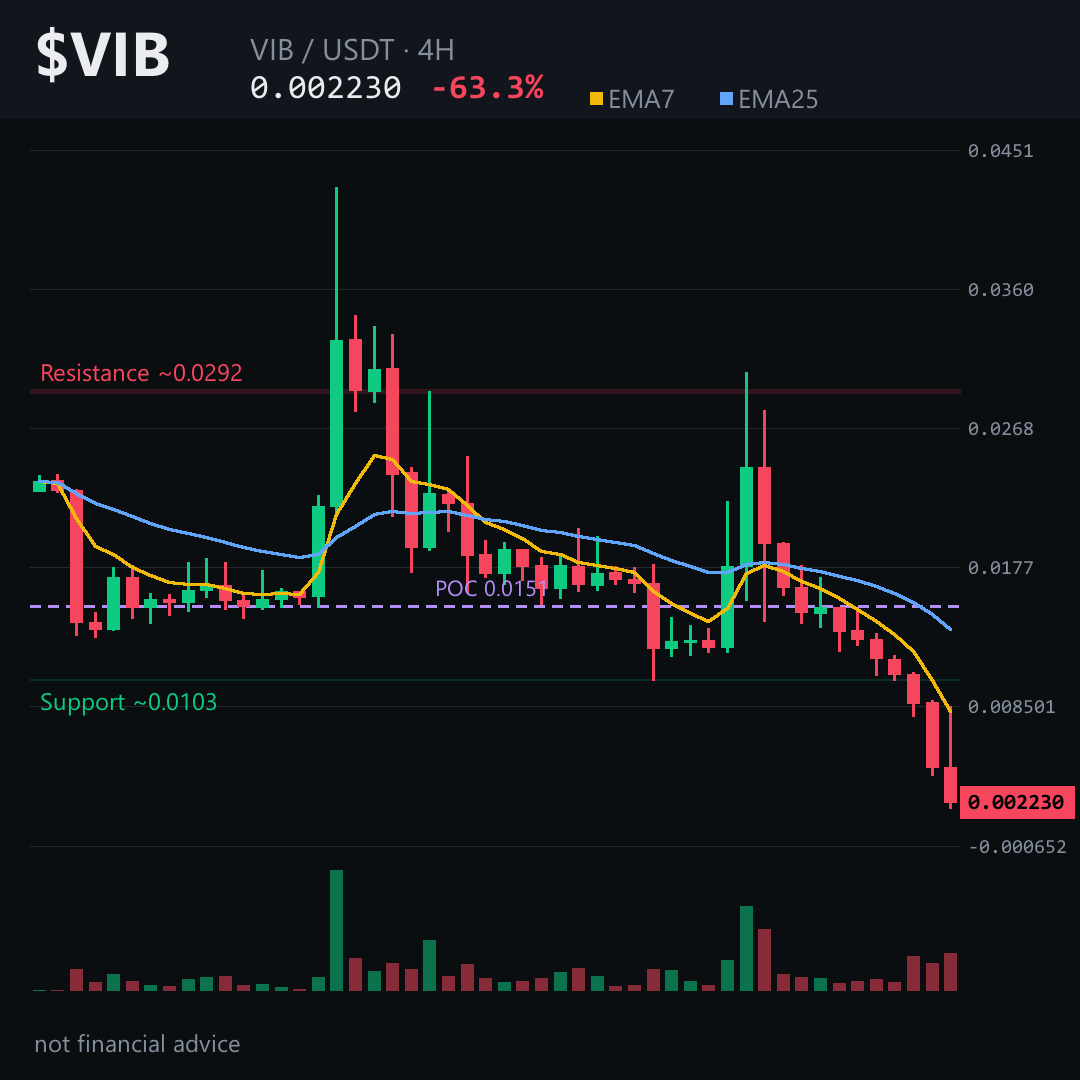
Your loss is staring at the 0.00235 ceiling – $VIB is about to test it.
Read on 👇
Price is deep in the red, 10 of 12 candles down, RSI under 30, and the 4‑hour EMA7 sits well under EMA25. Yet the chart hides a bearish gap that could pull the market lower.
On the 4‑hour picture the current price hovers around the 0.00224 area. The next barrier is the ~0.00235 zone – a break above this level on a 4H close would invalidate the bearish case. The downside target sits near the 0.00204 zone, where the volume‑profile point of control sits, offering the next demand pocket. Tap $VIB to pull up the chart and see these zones yourself.
The structure points to another leg down; the real risk is a surprise bounce above 0.00235.
If you want a follow‑up when that ceiling cracks or holds, hit follow – I’ll break down the next move. What level do you think will hold the most pressure on $VIB? 👇
⚠️ Not financial advice. DYOR. #VIB #Crypto #BinanceSquare
Read on 👇
Price is deep in the red, 10 of 12 candles down, RSI under 30, and the 4‑hour EMA7 sits well under EMA25. Yet the chart hides a bearish gap that could pull the market lower.
On the 4‑hour picture the current price hovers around the 0.00224 area. The next barrier is the ~0.00235 zone – a break above this level on a 4H close would invalidate the bearish case. The downside target sits near the 0.00204 zone, where the volume‑profile point of control sits, offering the next demand pocket. Tap $VIB to pull up the chart and see these zones yourself.
The structure points to another leg down; the real risk is a surprise bounce above 0.00235.
If you want a follow‑up when that ceiling cracks or holds, hit follow – I’ll break down the next move. What level do you think will hold the most pressure on $VIB? 👇
⚠️ Not financial advice. DYOR. #VIB #Crypto #BinanceSquare