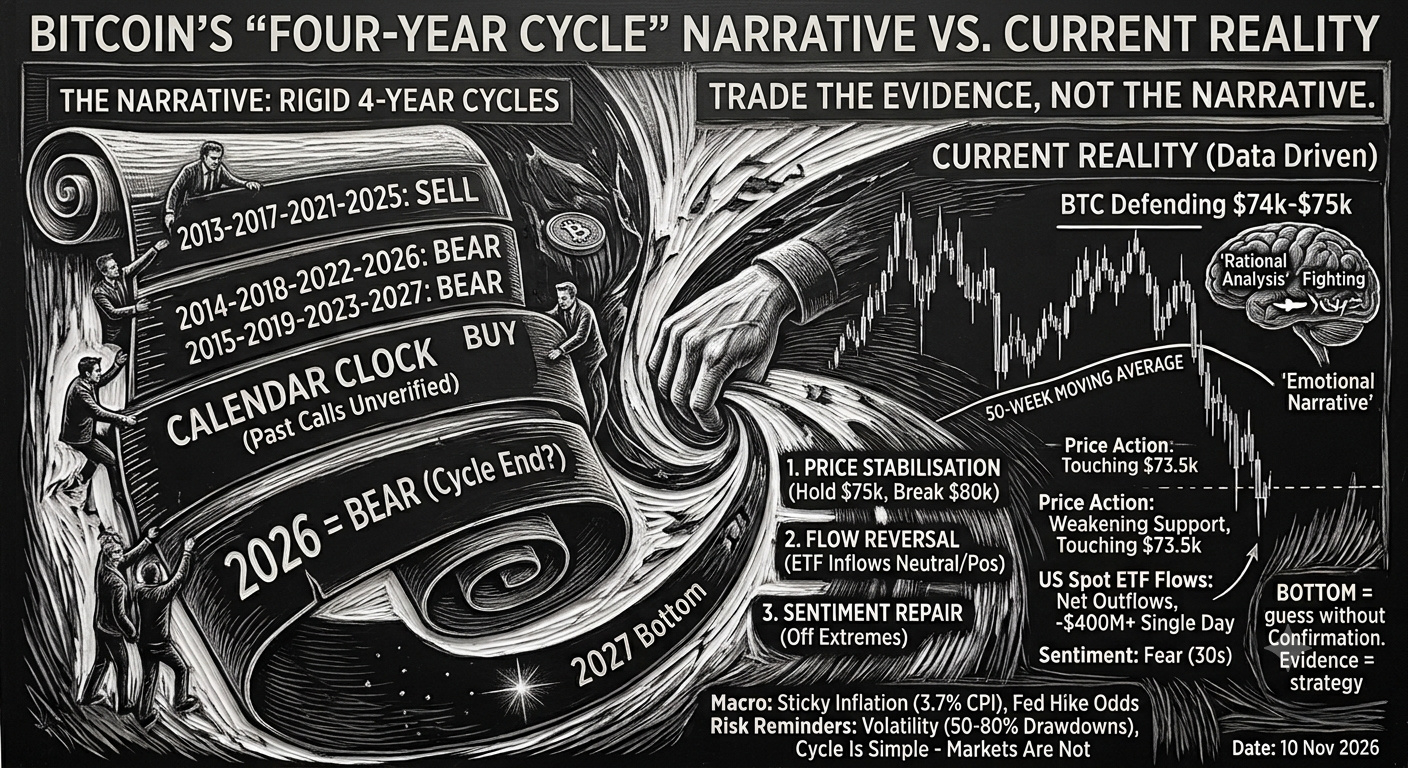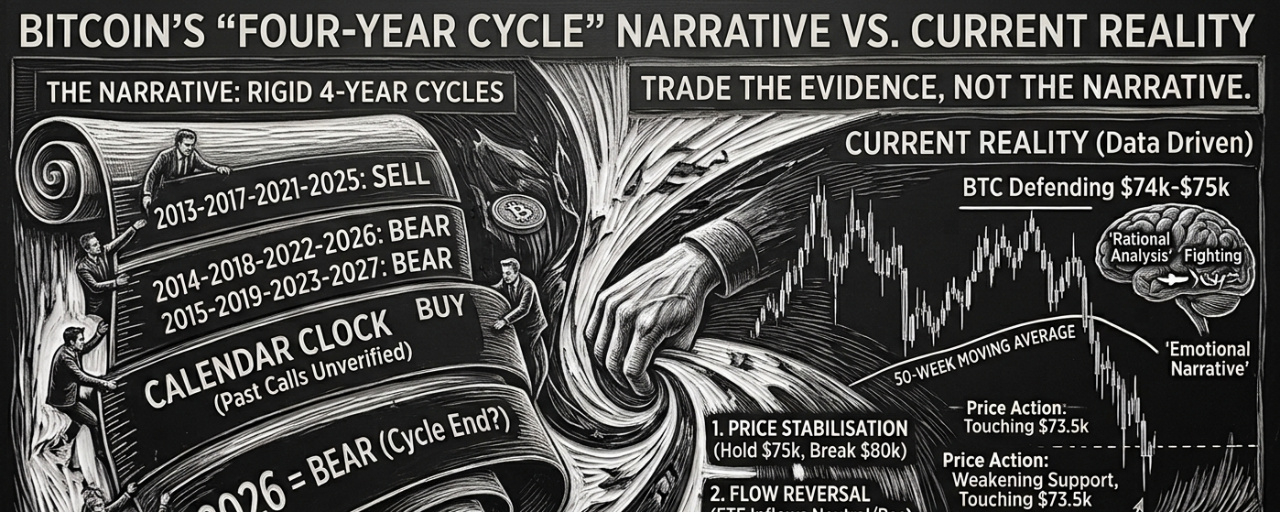

👀 Bitcoin's "Four-Year Cycle" Narrative vs. Current Reality
Date: 10 November 2026
Purpose: To test the popular four-year cycle narrative against observable market evidence and determine what is signal and what is story
The Narrative on Trial
The four-year cycle thesis holds that Bitcoin's price moves in a predictable rhythm tied to its halving schedule, with tops in 2013, 2017, 2021 and 2025, bear phases in 2014, 2018, 2022 and 2026, and accumulation windows in 2015, 2019, 2023 and potentially 2027. This framework has circulated widely and carries intuitive appeal because it has roughly aligned with three completed cycles.
But a narrative is only as good as its explanatory power today. The question this note addresses is simple: does the four-year cycle still describe what is actually happening in Bitcoin, or has the market's structure changed enough that the framework has outlived its usefulness?
Why the Cycle Framework Has Weakened Structurally
The most important challenge to the four-year cycle is not price action but market structure. Three developments have fundamentally altered how Bitcoin prices are formed.
👉 First, institutional capital has changed the composition of buyers and sellers. The launch of spot Bitcoin ETFs in early 2024 opened exposure to pension funds, asset managers and corporate treasuries. These participants behave differently from retail traders: they are slower to react, more focused on allocation than momentum, and capable of absorbing selling pressure that would previously have triggered cascading crashes. The result is a market with dampened volatility and less pronounced boom-bust extremes .
👉 Second, the halving's supply shock has diminished in relative importance. By 2024, over 90 percent of Bitcoin's total supply had already been mined, and the latest halving reduced annual inflation from roughly 1.7 percent to 0.85 percent. In a market where institutional buyers can acquire more Bitcoin in a single day than miners produce in weeks, the halving's ability to force prices higher through scarcity alone has weakened substantially .
👉 Third, Bitcoin has become a macro asset. It now moves in response to central bank policy, inflation expectations and global liquidity conditions. During the 2022 rate hikes, Bitcoin fell alongside equities; as liquidity improved between 2023 and 2025, it rallied. Analysts increasingly argue that Bitcoin is watching interest rates more closely than halving schedules. In this environment, price cycles follow broader economic waves, which are less predictable and less rhythmic than a four-year clock .
What the Current Market Actually Shows
The evidence from November 2026 supports the view that macro and flows, not the calendar, are driving price.
Price action. Bitcoin is trading near 74,000 to 75,000, having touched roughly 73,500, its lowest level since August, before recovering modestly . The asset recently closed a week below its 50-week moving average, a trend warning that has historically preceded both further declines and eventual recoveries . Resistance sits at 76,300 to 76,500, with the 20-day and 50-day exponential moving averages higher near 78,100 and 79,200. Support rests at 74,300 to 74,800, then 73,100 to 73,300 .
Sentiment. The Crypto Fear and Greed Index is in Fear territory, reading in the low 30s and having recently touched extreme fear levels near 25 before recovering slightly . For short-term traders, this reflects capitulation-style selling. For longer-term investors, extreme fear has historically preceded accumulation opportunities, but timing is unreliable because fear can persist for months.
Fund flows. US spot Bitcoin ETFs have recorded consecutive days of net outflows, with single-day outflows reaching 411.9 million dollars on 6 November and 201 million dollars on 9 November . BlackRock's IBIT has led the redemptions. This is measurable institutional de-risking, and it contradicts any claim that smart money is quietly accumulating.
Macro backdrop. October CPI rose 0.4 percent month-on-month, above the 0.3 percent expectation, while core CPI rose 0.3 percent, also above forecast. Fed officials have signaled support for a December rate hike, with market pricing for a 25 basis point move at roughly 84 percent and discussion of a 50 basis point option returning to the table . AI-related capex concerns have pressured technology stocks, and Bitcoin has moved in sympathy. The sell-off is synchronized with risk assets broadly, not with a cyclical calendar.
The Counterargument: Does the Cycle Still Have Defenders?
Some analysts argue the cycle remains intact. Galaxy's Alex Thorn noted that Bitcoin has twice before slipped below its 50-week moving average after a bear-market bottom, in 2011-12 and 2019-20, and both times rebounded to new highs without making a lower low. He identifies 59,517 dollars, the June 2026 low, as the critical level to watch. If that holds and Bitcoin reclaims the 50-week average soon, the bullish structure could remain valid .
This is a fair point, but it is a conditional argument, not a confirmation of the four-year rhythm. It requires price to prove itself, not the calendar. And Thorn himself acknowledges the sample size is small, with only five relevant cases and no certainty until much later .
Practical Framework: What Would Confirm a Bottom
The four-year cycle narrative is most dangerous when it substitutes for evidence. A trader who buys simply because the calendar says 2027 is making a bet on a story. A trader who waits for confirmation is making a decision based on data.
Three confirmations should be demanded together before treating any level as a durable bottom.
Price stabilisation. Bitcoin reclaims and holds 74,000 to 75,000, then breaks through 78,000 to 80,000. A daily close back above 75,000 would be a first step; failure to hold risks another leg lower .
Flow reversal. ETF net outflows stop and turn neutral or positive. Until institutional demand stabilises, spot buying pressure alone will struggle to absorb supply.
Sentiment repair. Fear readings recover off extremes alongside improving price structure. Sentiment alone is a poor timing tool, but it can confirm a shift when paired with price and flows.
Risk Reminders
Crypto remains highly volatile, with drawdowns of 50 to 80 percent historically normal. Cycle-based narratives are popular because they simplify a complex market, but simplicity is not accuracy. Social media claims about past calls are marketing, not research. Position sizing and risk management matter more than any single prediction. Past performance does not guarantee future results.
Bottom Line
The four-year cycle is a useful historical lens. It is not a reliable forecast for 2026 and beyond. The market structure that produced the old rhythm, retail-dominated and supply-shock-driven, has been replaced by one shaped by institutional flows, macro liquidity and interest rate expectations. Bitcoin's current bear phase is real, but it is being driven by ETF outflows, sticky inflation and tightening expectations, not by the calendar flipping to a bear year. The end of this phase will be confirmed by price structure, fund flows and sentiment turning together. Until then, the narrative should be treated as a hypothesis, not a strategy.

#BTC走势分析 #btc70k #BTC☀ #BTC🔥🔥🔥🔥🔥 #Binance