


After a robust 19% rally from its mid-August lows, Bitcoin is currently experiencing post-breakout fatigue. Trading at approximately $74,584 on Tuesday morning, the leading cryptocurrency has broken below its rising trend channel and is now testing critical support zones.
For traders and investors, the current market structure demands patience. Here is a comprehensive breakdown of the technical setup, the scenarios that will dictate Bitcoin’s next major move, and the macroeconomic catalysts on the horizon.
The Technical Setup is Testing Critical Support
Bitcoin’s recent pullback has brought the price down to the 200 day moving average at $73,139, stabilizing just above the crucial 2025 low of $74,421.
While the weekly and quarterly charts still reflect an established broader uptrend forming a rounding bottom pattern for 2026 the short term momentum has clearly stalled. The price is currently trapped below key moving averages, including the 100-day ($77,526) and 20-day ($78,119) lines. Until Bitcoin can reclaim the $78,000 level, downward pressure remains a distinct possibility.
The Playbook is Three Scenarios to Watch
In technical analysis, reacting to price action is more reliable than predicting it. Based on daily closing prices, we have defined three distinct scenarios:
The Bullish Scenario Breakout:
A daily close above the September high at $87,397 would invalidate the current fatigue and trigger a new long-term buy signal. If this level is cleared, the immediate target shifts to the 2026 yearly high of $97,964.
🟡 The Current Status :
As long as daily closes remain between the previous week’s low ($73,477) and the September high $87,397 , the market is in a consolidation phase. Monday’s close at $75,258 keeps us firmly in this "wait and see" territory.
🔴 The Bearish Scenario Breakdown :
A daily close below $73,477 would signal that the recent rally is over. This would open the door to deeper corrections, targeting the $72,000 zone and potentially retesting the 2021 all-time high of $69,000 acting as support.
Macro Catalysts and Market Sentiment
Beyond the charts, Bitcoin remains highly sensitive to macroeconomic data and institutional flows. This week, the primary catalyst is the US Consumer Price Index (CPI) data. Looking ahead, the US Jobs Report on December 4 will be the next major volatility trigger.
Additionally, the market is still digesting the late October Binance security incident. While Binance has restored most withdrawals and updated its proof of reserves, the speed of full network recovery will continue to test overall crypto market sentiment.
The Long Term View: Institutional Optimism Remains
Despite short term technical fatigue, the broader institutional outlook for the end of 2026 remains highly optimistic. Recent revisions from major financial institutions show a bullish consensus:
Fundstrat (Tom Lee): $200,000 – $250,000
JPMorgan: $150,000 – $170,000
Bernstein: $125,000
Citigroup: $113,000 12-month target
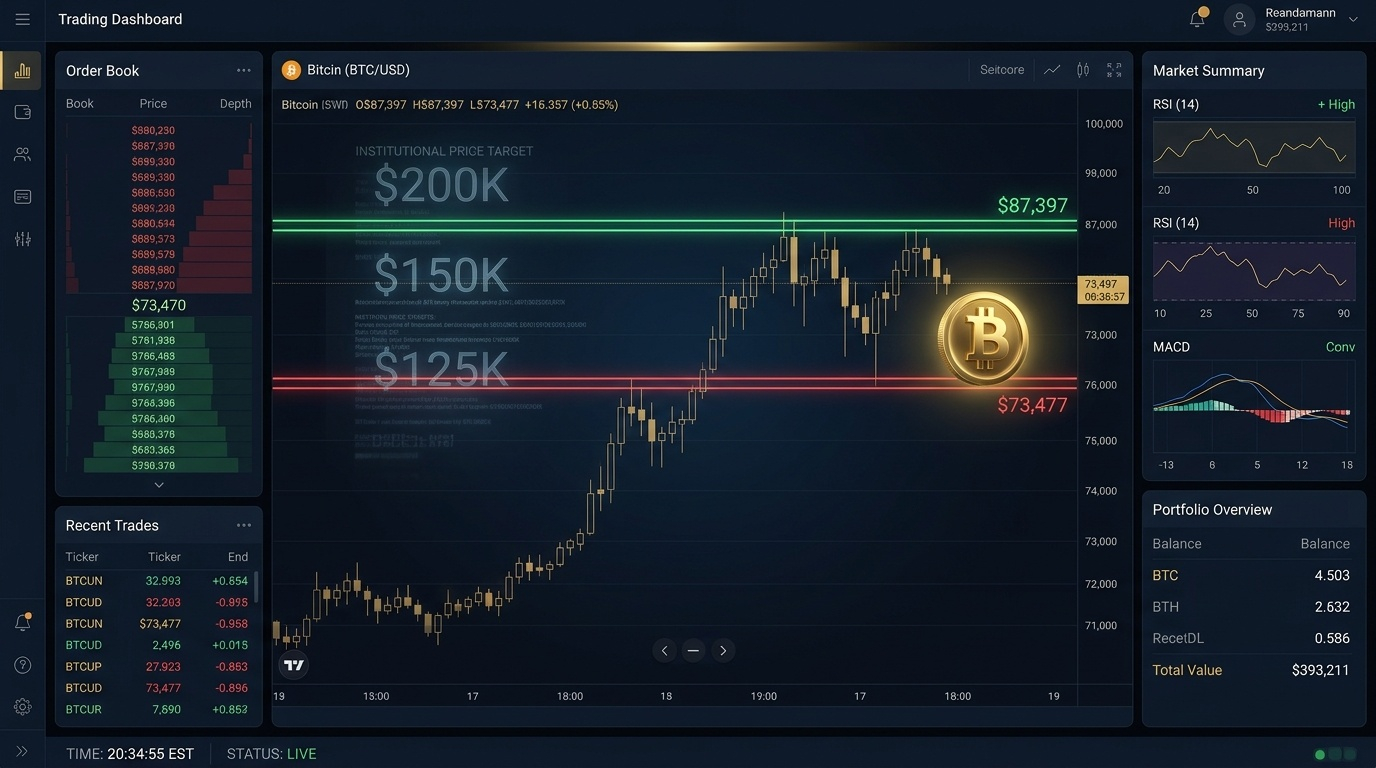
These targets are driven by valuation models and expected ETF inflows, contrasting with the short term erm technical consolidation we see on the daily charts.
Bitcoin is at a technical crossroads. The broader uptrend is intact on the weekly timeframe, but short-term fatigue requires a defensive posture. Traders should monitor the $73,477 support and $87,397 resistance levels closely. Until a daily close breaks these boundaries, the market is telling us to wait for a clear directional signal 👀 $BTC
