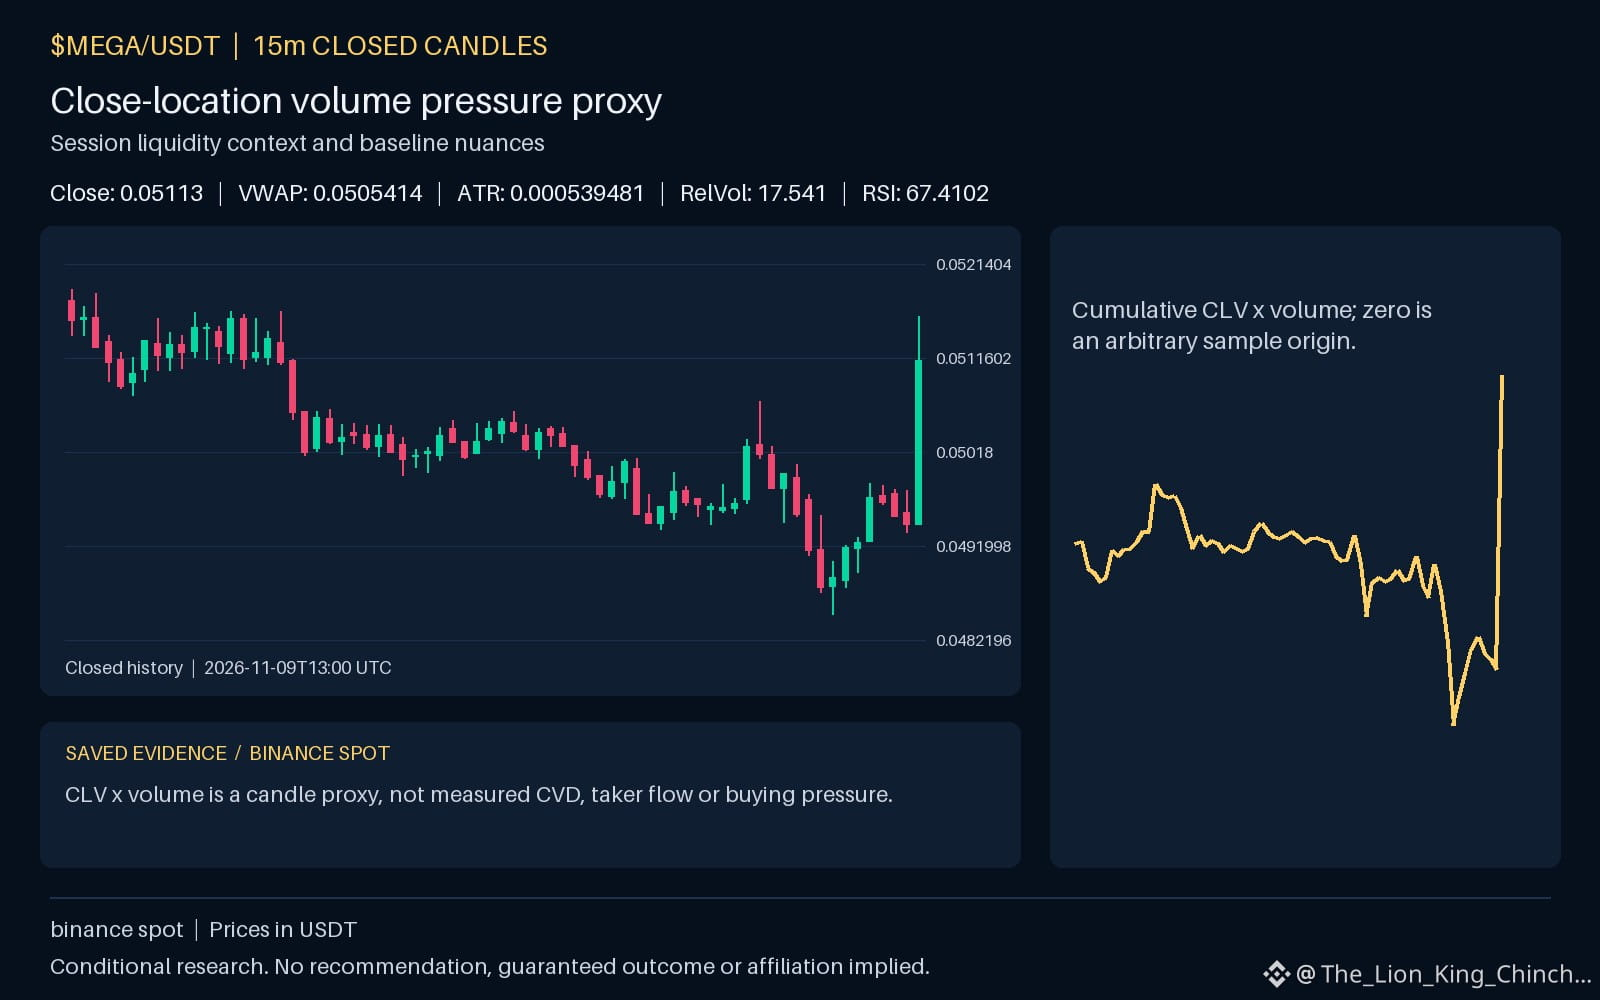
$MEGA: MEGA: Relative Volume and the Time of Day Myth
**The Observation**
The chart shows a relative volume spike while the price sits above resistance, and the hourly direction is up. This suggests an active session but the baseline candles that set the volume level were formed earlier in the day.
**A Conditional Explanation**
A common misconception is that a volume surge automatically signals a breakout regardless of when the baseline was built. In reality, volume is a relative measure: if the baseline was established during a low‑activity period, even moderate intraday buying can produce a spike. The mechanism is simple. The relative volume indicator compares the current period’s volume to an average over recent periods. If the average was taken when the market was quiet. say early morning. then a typical midday rally can appear inflated. Therefore, when you see a spike you should also ask: *When were the baseline candles drawn?* If they were formed during a lull, the spike may be a normal continuation, not a reversal.
**The Limits of the Evidence**
This reasoning uses only the supplied facts: volume, price, and baseline level. It does not claim causality, nor does it rely on order‑book depth, stop placement, or trader psychology. The observation is purely descriptive, and the explanation remains a hypothesis that would need further data to confirm. In short, a volume spike is not a standalone signal; the time of day when the baseline candles were created is a vital contextual factor.
Probabilistic market research, not a recommendation or guaranteed return.
When you see a relative volume spike, do you also check what time of day the baseline candles were formed?
#MEGA #CryptoLearning
**The Observation**
The chart shows a relative volume spike while the price sits above resistance, and the hourly direction is up. This suggests an active session but the baseline candles that set the volume level were formed earlier in the day.
**A Conditional Explanation**
A common misconception is that a volume surge automatically signals a breakout regardless of when the baseline was built. In reality, volume is a relative measure: if the baseline was established during a low‑activity period, even moderate intraday buying can produce a spike. The mechanism is simple. The relative volume indicator compares the current period’s volume to an average over recent periods. If the average was taken when the market was quiet. say early morning. then a typical midday rally can appear inflated. Therefore, when you see a spike you should also ask: *When were the baseline candles drawn?* If they were formed during a lull, the spike may be a normal continuation, not a reversal.
**The Limits of the Evidence**
This reasoning uses only the supplied facts: volume, price, and baseline level. It does not claim causality, nor does it rely on order‑book depth, stop placement, or trader psychology. The observation is purely descriptive, and the explanation remains a hypothesis that would need further data to confirm. In short, a volume spike is not a standalone signal; the time of day when the baseline candles were created is a vital contextual factor.
Probabilistic market research, not a recommendation or guaranteed return.
When you see a relative volume spike, do you also check what time of day the baseline candles were formed?
#MEGA #CryptoLearning