


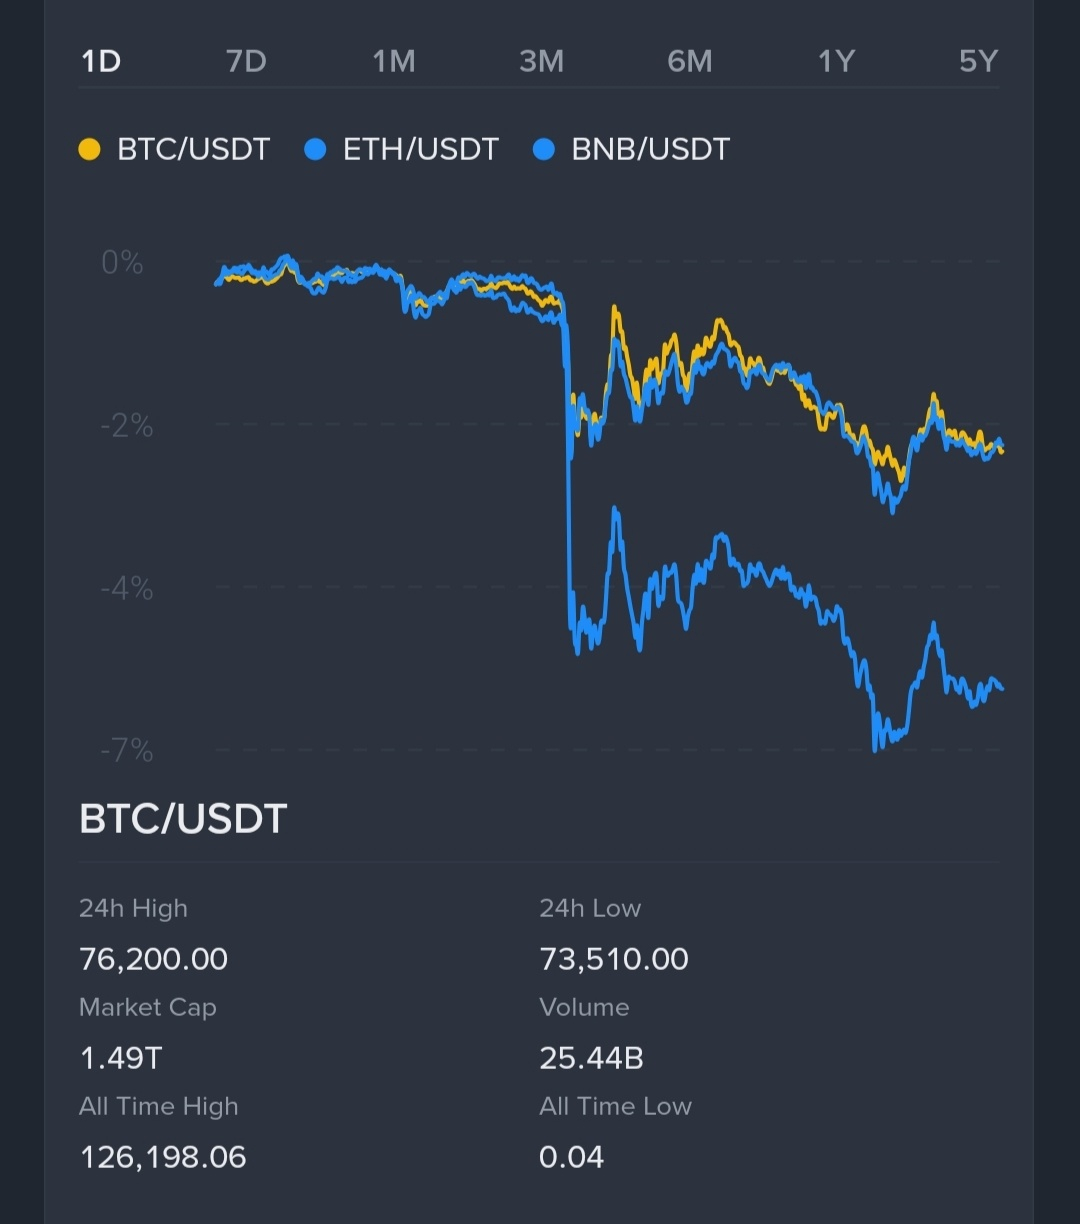
The crypto market is undergoing a broad, high-volatility sell-off on November 9, 2026. Binance spot data shows BTC at $74,101.37, down -2.39% from its 24-hour open of $75,916.01. ETH is at $2,107.36, down -5.77% from $2,236.31, while BNB is at $681.39, down -2.29% from $697.37.
This is not a single-asset decline. The simultaneous weakness in BTC, ETH, BNB and other large-cap cryptocurrencies suggests a market-wide reduction in risk exposure rather than a token-specific breakdown.



What happened during the session
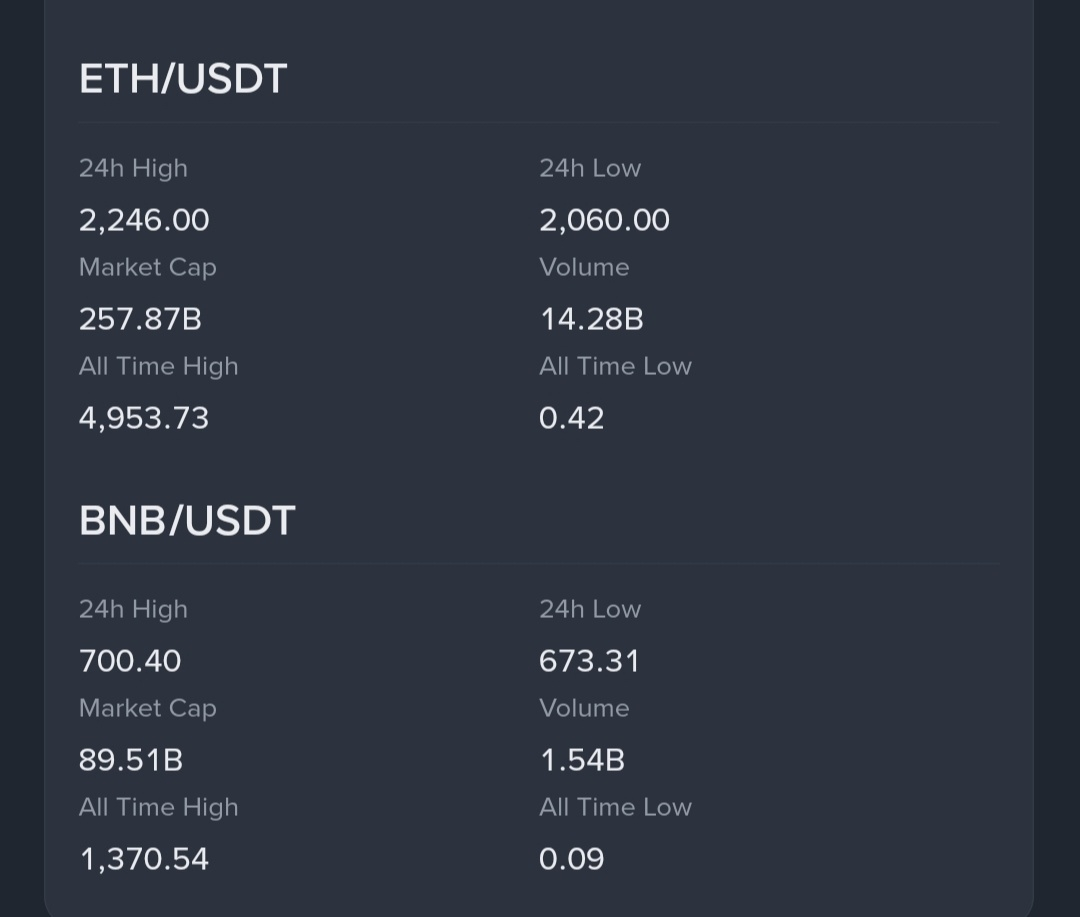
$BTC traded between $76,200.00 and $73,510.00, a range equal to 3.54% of its 24-hour opening price. $ETH ’s range was much wider: it moved between $2,246.00 and $2,060.00, or 8.32% of its opening price. $BNB B traded between $700.40 and $673.31, a 3.88% range.
The speed of the decline matters. BTC finished -2.75% below its session high, ETH -6.17% below its high, and BNB -2.71% below its high. That pattern shows ETH carrying substantially greater downside volatility than BTC and BNB during this wave of selling.
The main driver: a leverage unwind
The most clearly reported market mechanism behind the move is a wave of derivatives liquidations. Public market reports estimate that more than $1B in leveraged crypto positions were liquidated over the latest 24 hours, with long positions making up around 90% of the total.
A liquidation cascade can magnify a normal price decline:
Prices start falling as traders reduce risk or sell spot holdings.
Leveraged long positions lose collateral value.
Exchanges automatically close positions that no longer meet margin requirements.
Those forced closures generate additional sell orders.
The extra selling can trigger more liquidations at lower prices.
This does not prove that leverage initiated the entire downturn. It does show why the move became sharper once major assets began falling: forced long closures can turn declining prices into a self-reinforcing short-term sell-off.
Risk-off pressure from outside crypto
The broader backdrop also appears risk-off. Same-day reporting linked the crypto decline with volatility in technology and AI-related equities, while concerns around macro conditions and institutional flows added to caution across high-beta assets.
Crypto often trades as a high-volatility risk asset during abrupt shifts in sentiment. When investors reduce exposure to growth-oriented or speculative assets, liquid markets such as BTC and ETH can react quickly. Smaller or more leverage-sensitive assets frequently move even more sharply because their market depth is thinner and their derivatives positioning can be more crowded.
There is no single verified headline that fully explains the whole move. The most defensible reading is that external risk aversion created selling pressure, then leverage turned that pressure into a faster market-wide drawdown.
Why ETH is falling more than BTC
ETH’s -5.77% decline is more than double BTC’s -2.39% drop over the same latest 24-hour period. Its intraday range was also over twice as wide as BTC’s.
That relative weakness is consistent with three factors:
Higher sensitivity to leverage: ETH derivatives positioning can react more aggressively during a broad deleveraging event.
Greater beta: ETH commonly experiences larger percentage swings than BTC during market-wide risk-off moves.
Additional ecosystem uncertainty: The November 8 daily market brief noted developer concerns about proposed changes tied to Ethereum’s Glamsterdam upgrade. That does not establish the upgrade discussion as the trigger for today’s drop, but it adds an asset-specific source of caution during an already fragile market session.
Public reporting also indicates that ETH accounted for a large share of the long liquidations in this sell-off, which is consistent with its greater price decline.
BTC: the market’s main liquidity barometer
BTC fell to $73,510.00 at its session low before recovering to around $74,101.37. It remains the primary liquidity reference point for the broader crypto market: when BTC breaks lower quickly, risk reduction tends to spread across major altcoins.
BTC’s relative resilience versus ETH does not mean the pressure has disappeared. It indicates that, so far, BTC is absorbing the sell-off with a smaller percentage loss than ETH. The key short-term question is whether trading stabilizes above the session low or whether renewed selling and leverage stress push BTC back toward it.
BNB: broad-market selling, not a clear BNB-specific event
BNB fell -2.29% to $681.39, after reaching a low of $673.31. Its decline is close to BTC’s in percentage terms and materially smaller than ETH’s, which fits a broad-market explanation more than an identifiable BNB-specific catalyst.
BNB’s ability to remain above its session low shows some stabilization, but that is only an observation of the current price structure—not evidence that the market-wide risk-off phase has ended.
What to watch next
The next phase of this move is likely to be shaped by market structure rather than a single narrative:
Whether BTC holds above $73,510.00: A sustained hold would indicate that selling pressure is being absorbed around the session low; another break below it would show that sellers still control the immediate move.
Whether ETH remains disproportionately weak: ETH holding near or revisiting its $2,060.00 low will be a useful gauge of whether leverage unwinding is still concentrated in altcoins.
Liquidation and derivatives conditions: Lower forced-selling pressure would reduce one source of downside acceleration. Continued heavy long liquidations would indicate lingering leverage stress.
Broader risk sentiment: Continued volatility in technology and AI-linked equities could keep pressure on crypto because the current move is behaving like a cross-market risk reduction event.
Bottom line
The November 9 decline is best understood as a broad deleveraging event within a risk-off market environment. BTC, ETH and BNB are all lower, but ETH is clearly the weakest of the three on the latest 24-hour numbers. The evidence supports liquidation-driven amplification of the sell-off, while external risk sentiment and uncertainty around institutional demand appear to be contributing background pressures.
The immediate market picture remains volatile and uncertain. A temporary bounce from today’s lows would not by itself establish a durable recovery, while new lows accompanied by elevated liquidation activity would suggest that the deleveraging cycle remains active.
Some information in this article comes from external web sources.
The above is market analysis and does not constitute investment advice.