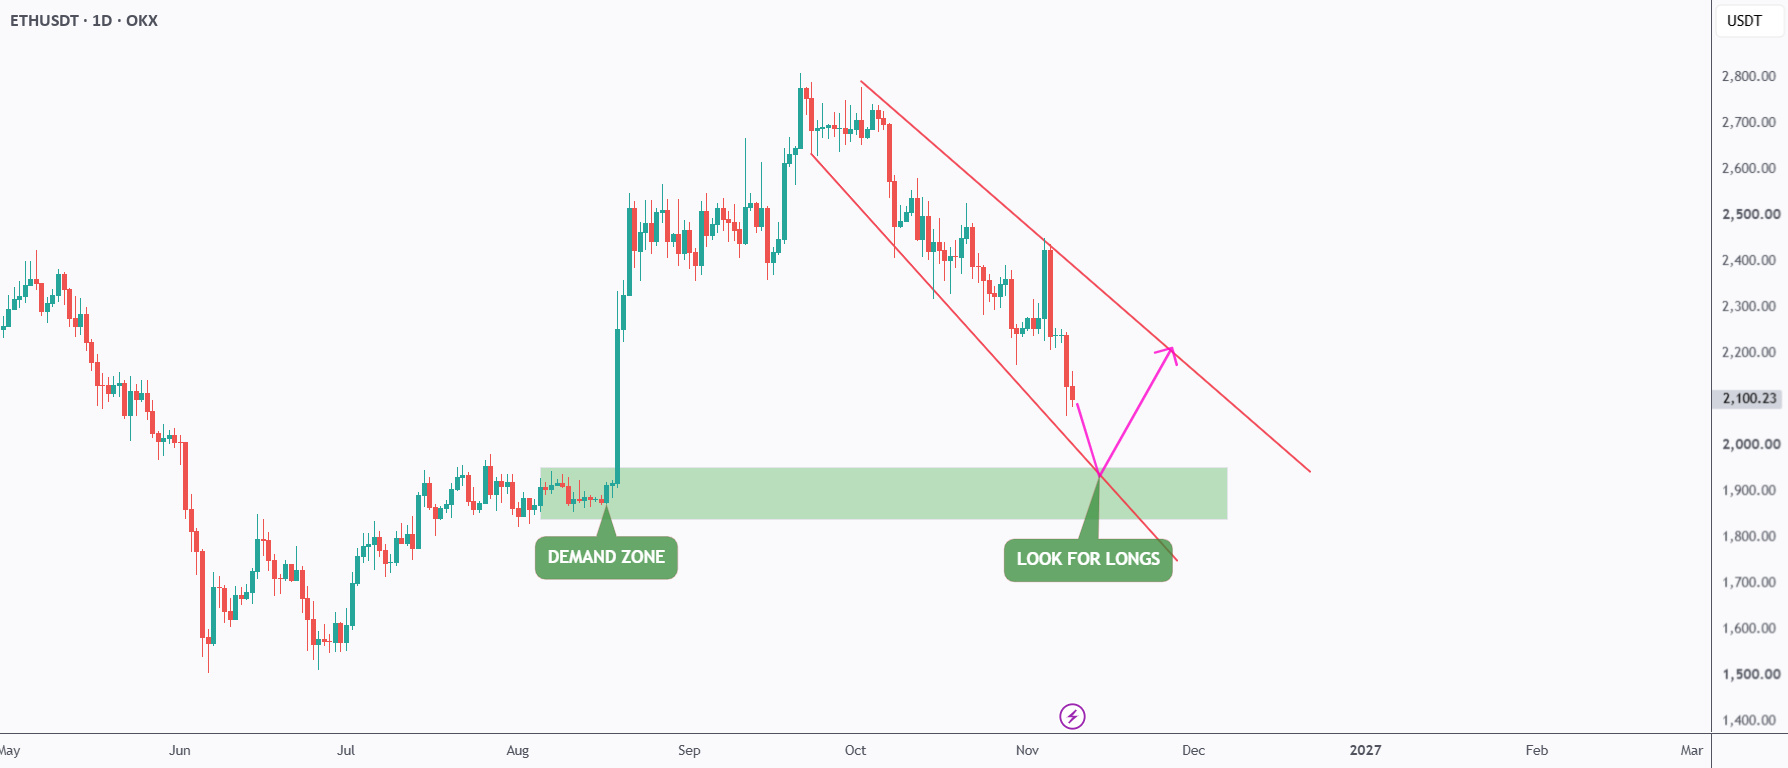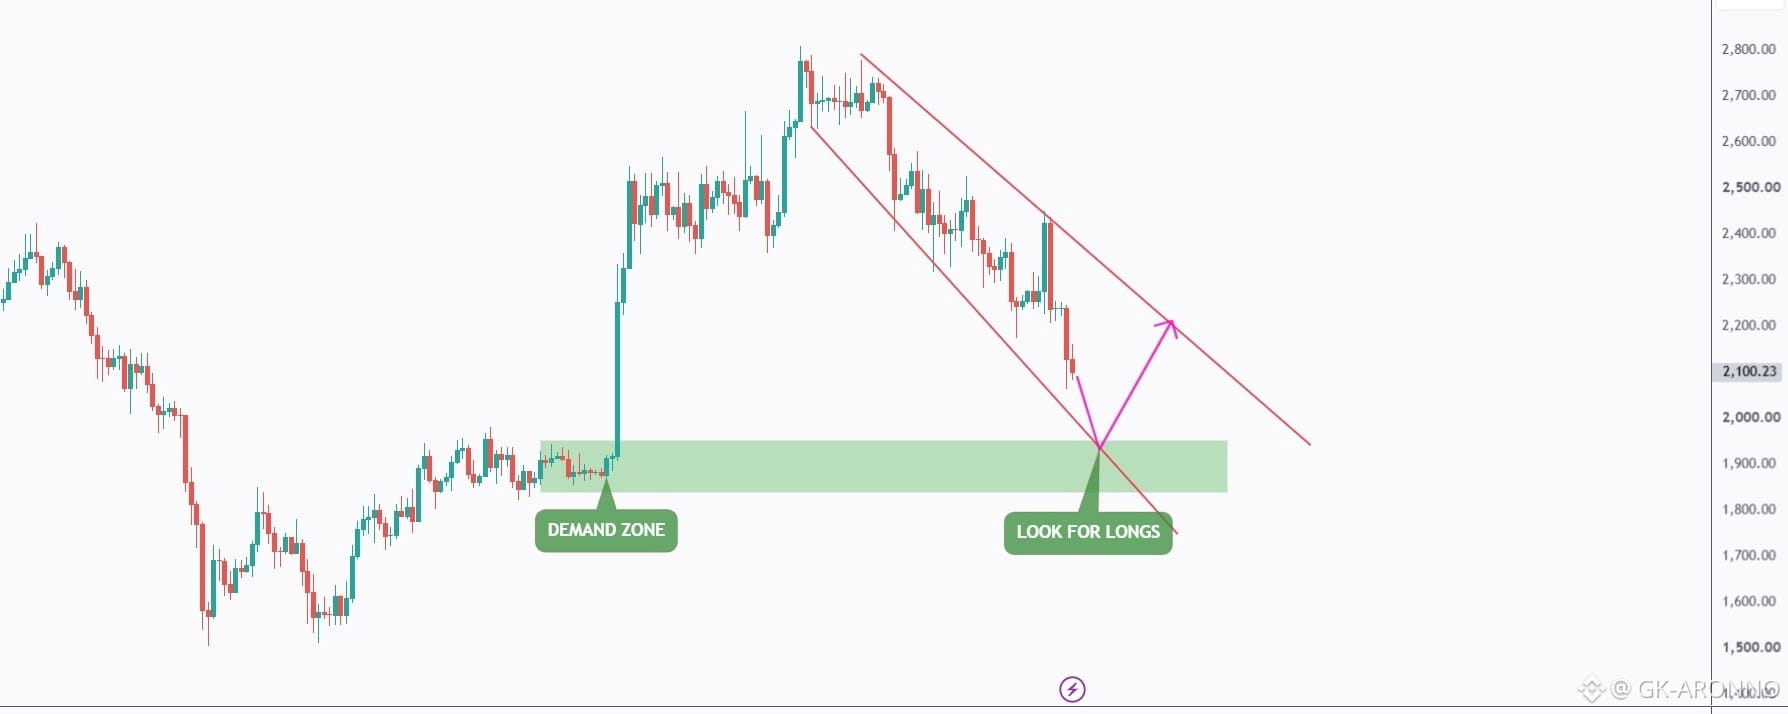


ETH has been overall bearish, trading within the falling wedge pattern marked in red, with sellers maintaining control of the recent price action.
However, ETH is now approaching an interesting area where multiple technical factors come together.
📊 Technical Outlook
ETH is retesting the lower boundary of its falling wedge, which is considered a potential oversold zone.
Moreover, this lower red trendline intersects with a strong demand zone marked in green, around $1,840–$1,950.
This creates an interesting confluence of two technical factors:
Lower wedge boundary: A potential area for bullish reactions.
Demand zone: A key support area where buyers previously stepped in.
📈 Preferred Scenario
As long as this intersection holds, we will be looking for bullish confirmation and buy setups, anticipating a potential recovery toward the upper boundary of the falling wedge.
A confirmed breakout above the upper red trendline would further strengthen the bullish scenario and suggest a potential shift in momentum.
📌 Important Note
Although ETH remains bearish, buying opportunities can still emerge within a downtrend, especially around strong support areas.
The key is not to predict the exact bottom, but to wait for buyers to confirm their presence before considering an entry.
⚠️ Disclaimer: This analysis is for educational purposes only and does not constitute financial advice. Always manage your risk.
Plan Your Trade and Trade Your Plan. 🍀