
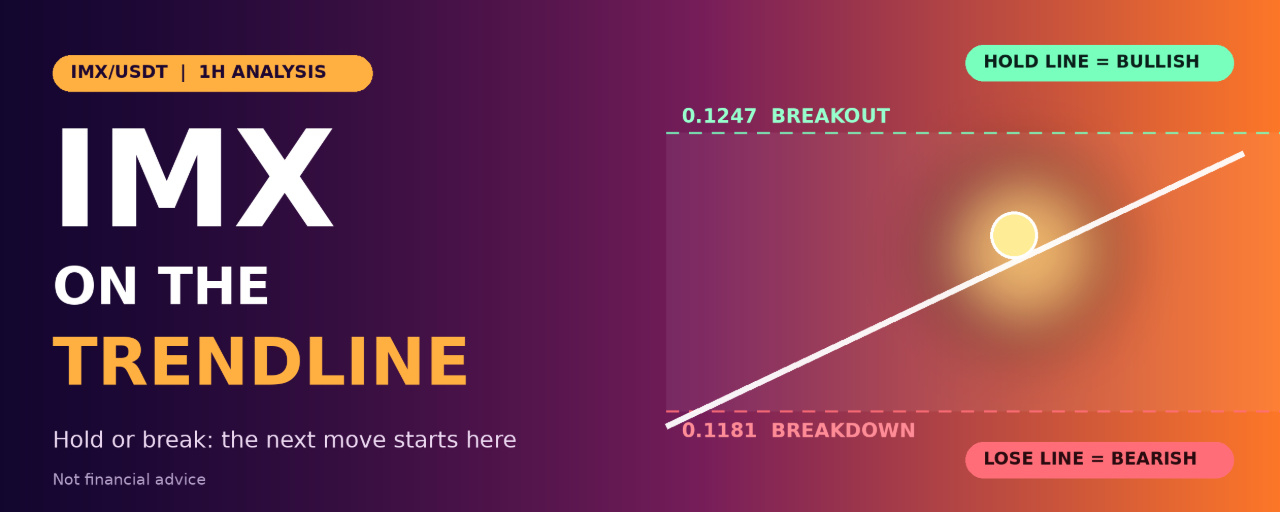


IMX is trading near $0.1199, sitting right on a rising trendline that has guided price since the November 5 low. At the same time, it is testing the 38.2% Fibonacci retracement, and it is trapped inside a box between about $0.1181 and $0.1247. Trendline, Fib level and range edge all meet here, which makes this one of the cleaner decision points on the board. Below is how to read it and how to trade both outcomes.
What the 1H Chart Is Telling Us
1. The trendline is the story. After the sharp drop to the Higher Low near $0.1132, IMX has been making a slow staircase upward along an ascending trendline. Price is touching that line again right now. Each touch that holds strengthens the line, but each touch also makes it more likely to fail.
2. Lower highs cap the upside. Despite the rising support, the highs have been getting rejected near $0.1230 and $0.1247. The latest wick to $0.1247 was sold quickly. This is a classic ascending-triangle style squeeze, with support rising into a ceiling that keeps rejecting price.
3. The 38.2% Fib is acting as the pivot. Measured across the recent move, the retracement levels are:
38.2% near $0.1197 (price is here now)
50% near $0.1182 (lines up with the bottom of the box)
61.8% near $0.1167
Holding 38.2% keeps momentum with the bulls. Losing it points to 50% and 61.8% as the next stops.
3. A small bullish Fair Value Gap (FVG) sits just below price. It lines up with the trendline and the 50% level, which makes the $0.1181 to $0.1190 area an important demand pocket.
Key Levels to Watch
$0.1265 – Higher High. The major swing high and final upside target.
$0.1247 – Range top. Wick high and the ceiling bulls must break.
$0.1230 – Lower high. First resistance on the way up.
$0.1197 – 38.2% Fib. Current pivot, where price is sitting.
$0.1181 – Range bottom and 50% Fib. The last line before the trendline fails.
$0.1167 – 61.8% Fib. First downside target.
$0.1132 – Higher Low. Structural support and the major downside target.
Scenario 1: Trendline Holds (Bullish Bounce and Breakout)
Buyers defend the line and push price back into the upper half of the range.
Bounce setup
Entry: $0.1190 to $0.1200, after a bullish 1H candle closes on or above the trendline
Stop loss: $0.1174 (below the range bottom and 50% Fib)
Take profit 1: $0.1230
Take profit 2: $0.1247
Take profit 3: $0.1265
Risk to reward from the middle of the entry zone to the second target is about 1:2.5.
Breakout setup
Trigger: A 1H close above $0.1247
Entry: Retest of $0.1240 to $0.1247 holding as support
Stop loss: $0.1222
Take profit 1: $0.1265
Take profit 2: $0.1290
A confirmed break above the range top would also flip the lower-high structure bullish, which is why the retest entry is worth waiting for.
Scenario 2: Trendline Breaks (Bearish Breakdown)
If sellers push price through the line and the range floor together, the squeeze resolves downward.
Trigger: A 1H candle close below $0.1181
Entry: Retest of $0.1178 to $0.1181 from below, showing rejection
Stop loss: $0.1198 (back above the trendline and 38.2% Fib)
Take profit 1: $0.1167
Take profit 2: $0.1150
Take profit 3: $0.1132
Risk to reward is roughly 1:1.5 at the second target and 1:2.5 at the third. A trendline break after several touches often brings a fast move, so consider moving the stop to break-even after the first target.
Invalidation: When to Step Aside
The bullish idea is invalid if price closes below $0.1181.
The bearish idea is invalid if price closes back above $0.1198 after the breakdown.
A wick through the trendline that closes back above it is a fake-out, not a break.
If price keeps chopping between $0.1181 and $0.1247, there is no edge. Wait for a close outside the box.
Risk Management Rules
Risk 1% to 2% of your account per trade at most.
Always use a stop loss and never widen it.
Take partial profits at the first target and move the stop to break-even.
IMX is a small-cap altcoin and can spike on thin liquidity, so keep leverage low.
Check Bitcoin before entering. A sharp BTC move can override any altcoin setup.
Final Thoughts
IMX has reached the point where the trendline, the 38.2% Fib and the range floor all stack together. If buyers hold this zone, a move toward $0.1247 and the $0.1265 high is on the table. If the line breaks with a close below $0.1181, the path opens toward $0.1167 and the $0.1132 low. Do not predict. Wait for the close, enter on the retest, and let the stop loss do its job.
Disclaimer: This article is for educational and informational purposes only and is not financial advice. Cryptocurrency trading carries a high level of risk and may not be suitable for all investors. Entry and exit levels are based on technical analysis of a single chart and can fail. Always do your own research and never risk more than you can afford to lose.
@Binance Square Official #BinanceReopensWithdrawalsForHYPE&APT #SouthKoreaDraftLawTargets15To20%ShareholderCap #TradFiForBeginners #Binance #ChartSniper