


Before You Blinked: 341% in a single session. JCT didn't just pump—it executed a flawless, cold-blooded magic trick, leaving the mesmerized crowd staring at a massive vertical green candle while the backstage quietly emptied out into the cold, dark night and the insiders vanished into thin air with all the profits.
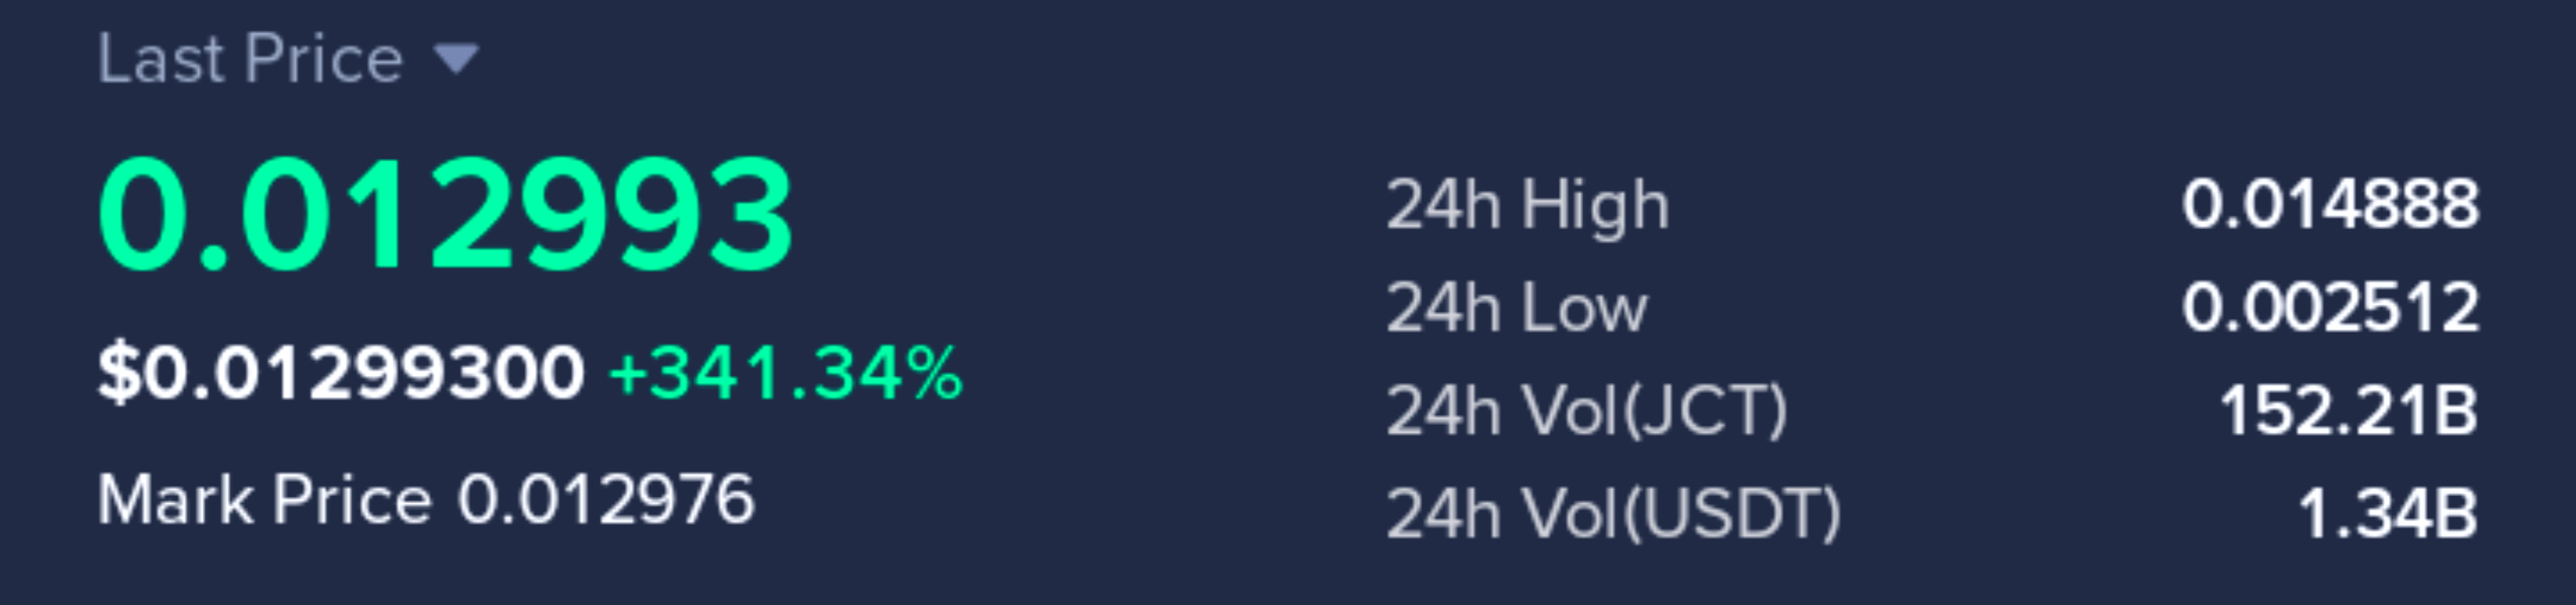
You think you're riding the next AI compute wave before the rest of the world catches on and gets left behind in the dust forever. In reality, you're just the human shield for a coordinated insider exit that was engineered to perfection weeks before you even opened the chart and decided to click buy.
Here's the catch. Over $7.7 million in forced closures hit the tape in just four hours, with the vast majority printing on one single side of the order book, proving the price didn't rise because of real organic demand from eager new buyers looking for a new home in the AI space—it rose because the other side simply ran out of room and the cascading dominoes were pushed over by pure design.
But look closer at the supply mechanics. A tiny cluster of wallets quietly controls 18% of what's actually circulating while the core team sits on a massive cliff of locked tokens, proving this isn't an open, free-flowing market where genuine price discovery happens, but a high-stakes puppet show with strings pulled by people who already know the exact ending.
Think about it. The RSI is already bleeding at 71, the vertical wick is fading into thin air, and the actual depth behind this entire move is an empty theatre with the house lights still on and absolutely nobody sitting in the seats waiting to buy your heavy bags from you.
$JCT is sitting on a critical pivot right now. If it loses this level, the structural failure will be fast, violent, and completely unforgiving, and the exit door is going to be much narrower than the crowded entrance you just fought through to get in.


$MET tells a similarly grim story. The chart shows a clean rejection from the highs at 0.33 and a heavy slide back down to 0.30, with top wallets holding nearly 72% of the total supply, leaving the structure as a fragile house of cards with the wind already blowing hard against it and the roof starting to cave in.

$AIA is even cleaner. The chart is a textbook bleeding pattern, dripping from 0.067 down to 0.060 with the RSI parked deep at 41, and since only 9.95% of the supply is floating, the price you see is just a thin screen being pushed around by a few players looking for a quick way out.

Are you trading the chart, or is the chart slowly trading you?