USDT and USDC: Two Stablecoins, Two Different Adoption Patterns
$DIA 's October 20 snapshot reveals some interesting differences.
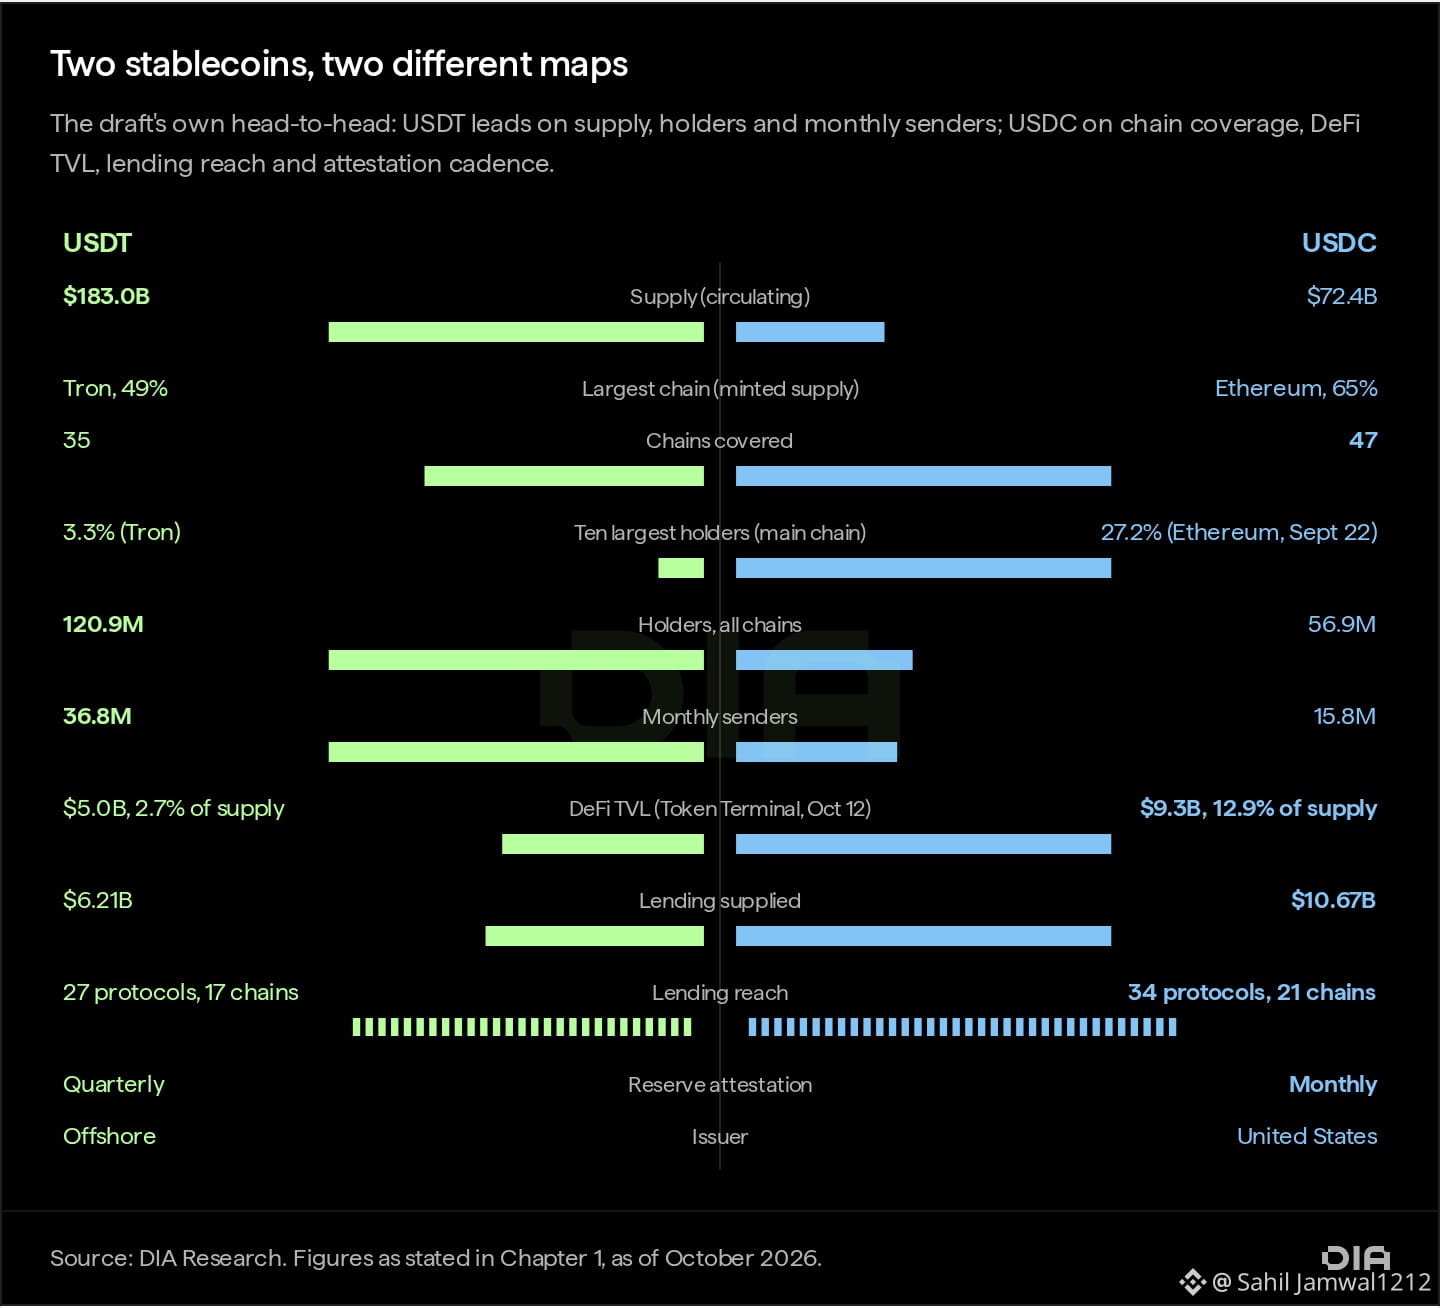
Circulating supply
USDT: $183B
USDC: $72.4B
Monthly senders
USDT: 36.8M
USDC: 15.8M
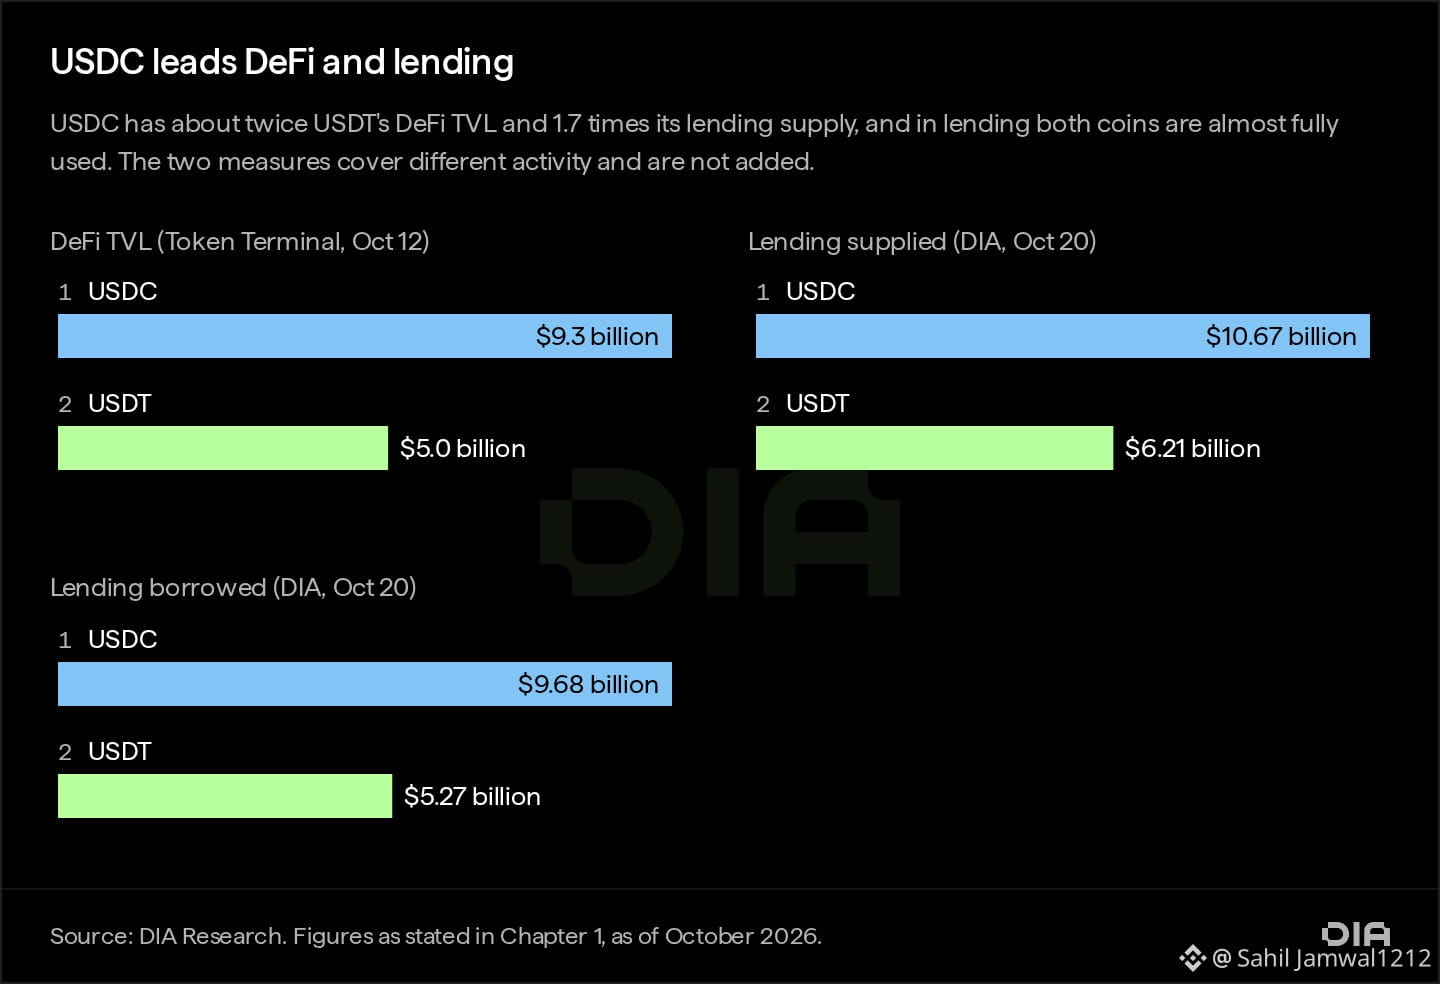
Lending supply
USDT: $6.21B
USDC: $10.67B
USDT reaches more holders and senders, while USDC has greater lending participation.
Lending absorbs just 3.4% of USDT's circulating supply, compared with 14.8% for USDC.
Their network distribution also differs:
USDT has a major presence on Tron and Ethereum.
USDC is concentrated more heavily on Ethereum, with significant supply on Solana, Hyperliquid and Base.
The takeaway?
Market cap alone cannot explain stablecoin adoption.
Chain distribution, active holders and lending activity show how capital is actually being used.
Same peg. Different machines.
Which stablecoin has the stronger adoption model?
$DIA 's October 20 snapshot reveals some interesting differences.
Circulating supply
USDT: $183B
USDC: $72.4B
Monthly senders
USDT: 36.8M
USDC: 15.8M
Lending supply
USDT: $6.21B
USDC: $10.67B
USDT reaches more holders and senders, while USDC has greater lending participation.
Lending absorbs just 3.4% of USDT's circulating supply, compared with 14.8% for USDC.
Their network distribution also differs:
USDT has a major presence on Tron and Ethereum.
USDC is concentrated more heavily on Ethereum, with significant supply on Solana, Hyperliquid and Base.
The takeaway?
Market cap alone cannot explain stablecoin adoption.
Chain distribution, active holders and lending activity show how capital is actually being used.
Same peg. Different machines.
Which stablecoin has the stronger adoption model?