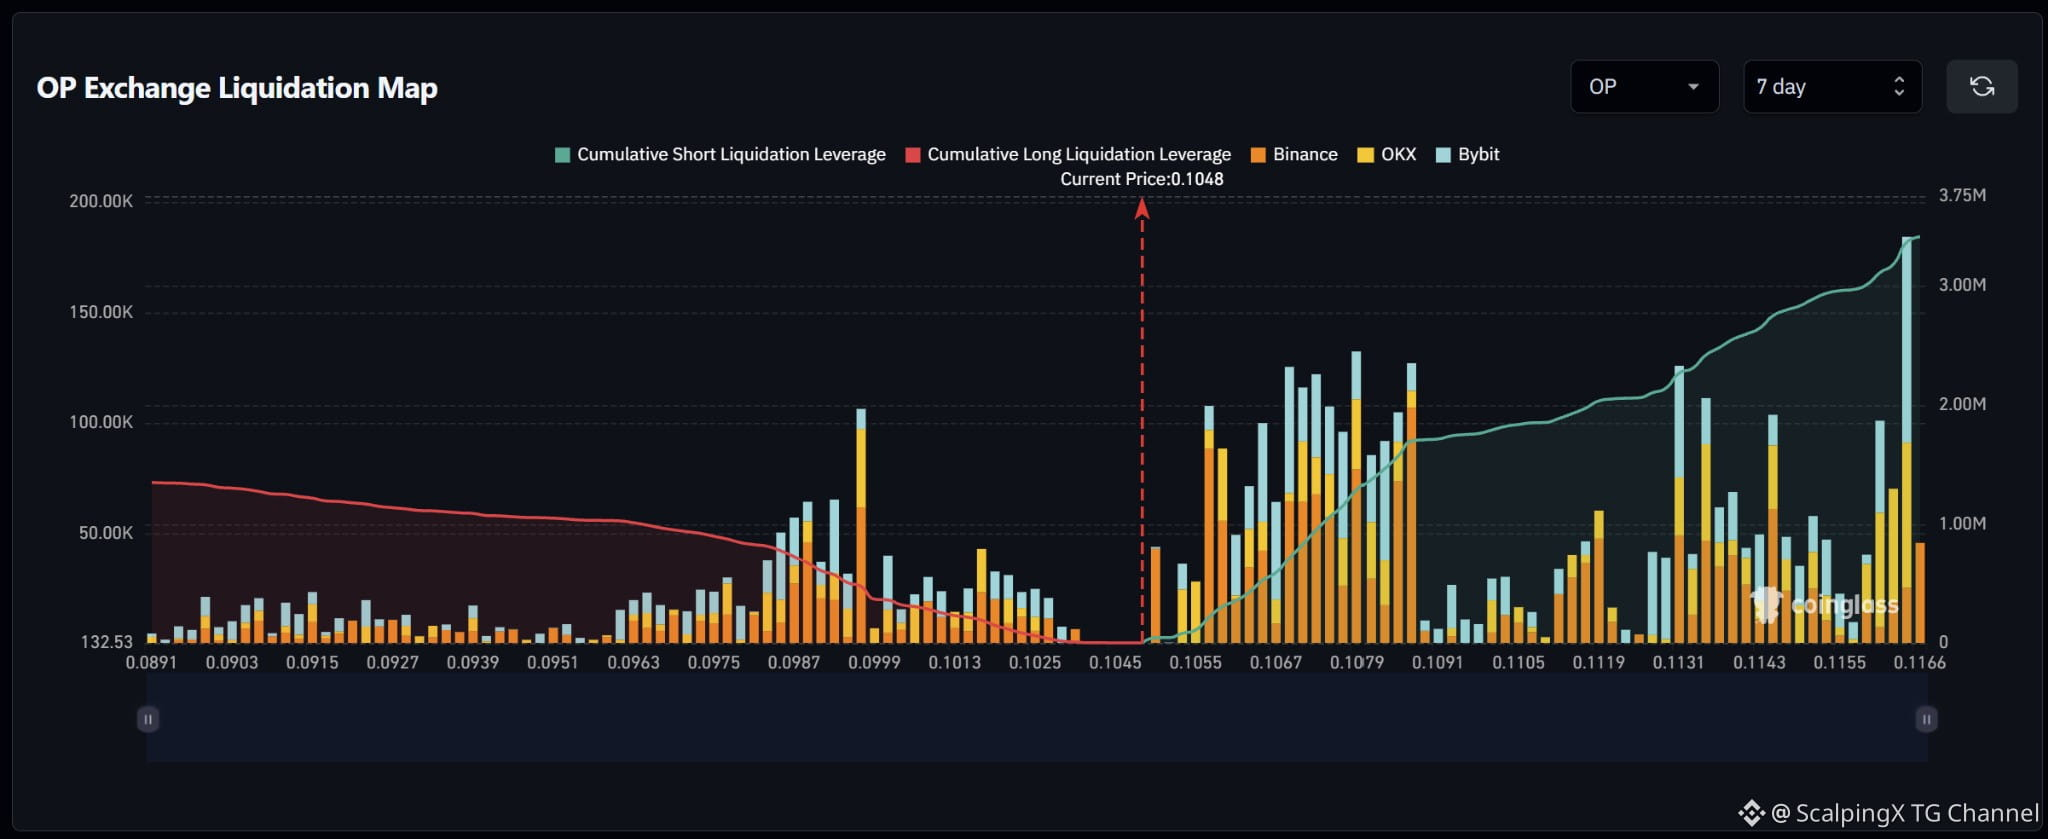
$OP – Liquidation Map (7 days) – Index ~0.1048
🧭 The preferred scenario is an upside short-liquidation sweep at 0.1056–0.1059. Short clusters are dense near price; estimated cumulative exposure is around $3.4M short versus $1.3M long within the displayed range.
🔺 Clearing and holding above 0.1059 shifts attention to 0.1063–0.1087. This range contains consecutive large bars, particularly near 0.1069, 0.1079 and 0.1087, where short liquidations could amplify volatility.
🎯 Holding above 0.1087 after the sweep brings 0.1110–0.1119, then 0.1130–0.1145, into focus. Bars around 0.1090–0.1108 are relatively small and sparse; a further large spike sits near 0.1164.
⚖️ Losing 0.1044 without reclaiming it weakens the upside scenario, shifting attention to 0.1020–0.1030, then 0.0985–0.0999. A sweep of 0.1056–0.1059 followed by a quick drop below 0.1055 would increase the risk of a failed upside move.
#LiquidationMap
🧭 The preferred scenario is an upside short-liquidation sweep at 0.1056–0.1059. Short clusters are dense near price; estimated cumulative exposure is around $3.4M short versus $1.3M long within the displayed range.
🔺 Clearing and holding above 0.1059 shifts attention to 0.1063–0.1087. This range contains consecutive large bars, particularly near 0.1069, 0.1079 and 0.1087, where short liquidations could amplify volatility.
🎯 Holding above 0.1087 after the sweep brings 0.1110–0.1119, then 0.1130–0.1145, into focus. Bars around 0.1090–0.1108 are relatively small and sparse; a further large spike sits near 0.1164.
⚖️ Losing 0.1044 without reclaiming it weakens the upside scenario, shifting attention to 0.1020–0.1030, then 0.0985–0.0999. A sweep of 0.1056–0.1059 followed by a quick drop below 0.1055 would increase the risk of a failed upside move.
#LiquidationMap