$BMT's breakout just got a second life — six hours after the tape buried it.
Last night's chapter was clean: the open-air break failed, six straight closes under $0.02959, $0.03288 to $0.02745 in twelve hours (-16.5%). Then five more closes under the line while volume dried to a whisper ($402k → $161k an hour). The line looked like a ceiling.
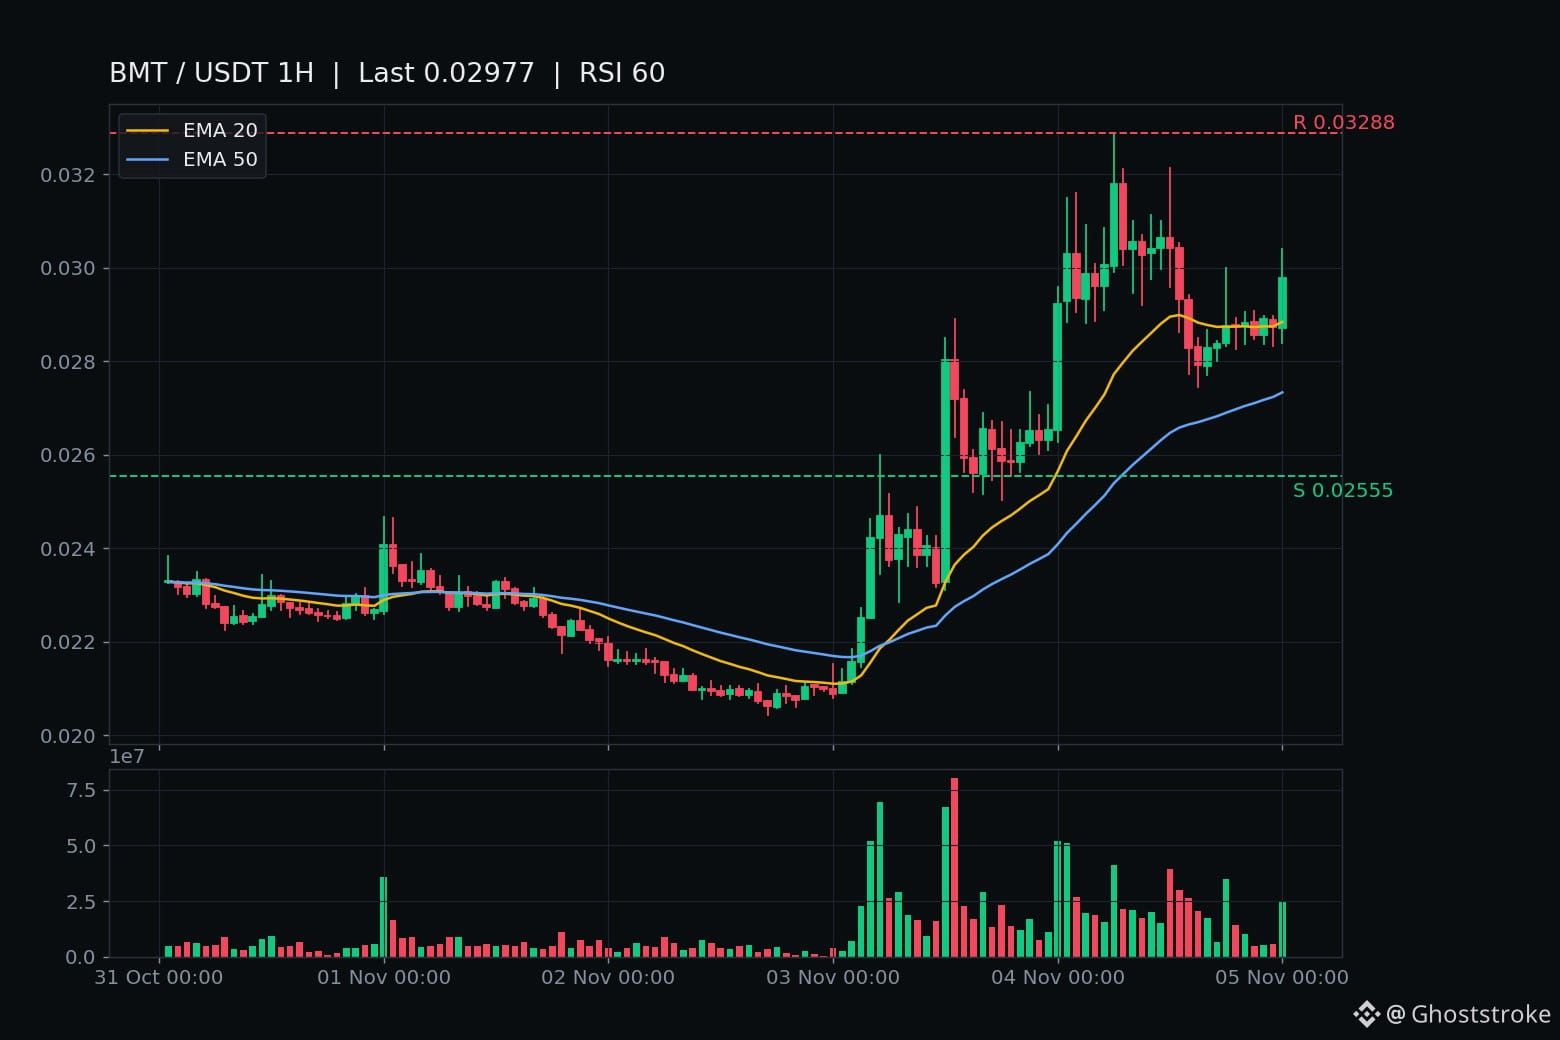
00:00 UTC changed the read. O $0.02872 → H $0.03040 → C $0.02977 on $727.2k — the first closed hour above $0.02959 in nine, on 1.8–5.2x the chop volume. The forming 01:00 hour pressed to $0.03050 before fading to $0.02946 live — unclosed, 02:00 UTC is the verdict (07:30 IST).
Live ~$0.0294, H $0.03288 / L $0.02745, $14.24M / 196.9k trades. Rank #791, $22.3M mcap — genuinely micro. Chart: RSI 60, price back above EMA20 ($0.02884), R $0.03288 / S $0.02555.
The honest other side: the close is only 0.6% above the line. No fresh timed headline — tape, not news (the Upbit listing is eleven days old). Every prior BMT leg unwound in full within hours. And at $22M, these move violently both ways.
Not a call, either way. But the question from last night's post has its answer forming: the 02:00 UTC close holds above $0.02959, and the breakout gets its second life. Back under, and the line becomes resistance again.
Does the 02:00 UTC close confirm it?
Last night's chapter was clean: the open-air break failed, six straight closes under $0.02959, $0.03288 to $0.02745 in twelve hours (-16.5%). Then five more closes under the line while volume dried to a whisper ($402k → $161k an hour). The line looked like a ceiling.
00:00 UTC changed the read. O $0.02872 → H $0.03040 → C $0.02977 on $727.2k — the first closed hour above $0.02959 in nine, on 1.8–5.2x the chop volume. The forming 01:00 hour pressed to $0.03050 before fading to $0.02946 live — unclosed, 02:00 UTC is the verdict (07:30 IST).
Live ~$0.0294, H $0.03288 / L $0.02745, $14.24M / 196.9k trades. Rank #791, $22.3M mcap — genuinely micro. Chart: RSI 60, price back above EMA20 ($0.02884), R $0.03288 / S $0.02555.
The honest other side: the close is only 0.6% above the line. No fresh timed headline — tape, not news (the Upbit listing is eleven days old). Every prior BMT leg unwound in full within hours. And at $22M, these move violently both ways.
Not a call, either way. But the question from last night's post has its answer forming: the 02:00 UTC close holds above $0.02959, and the breakout gets its second life. Back under, and the line becomes resistance again.
Does the 02:00 UTC close confirm it?