
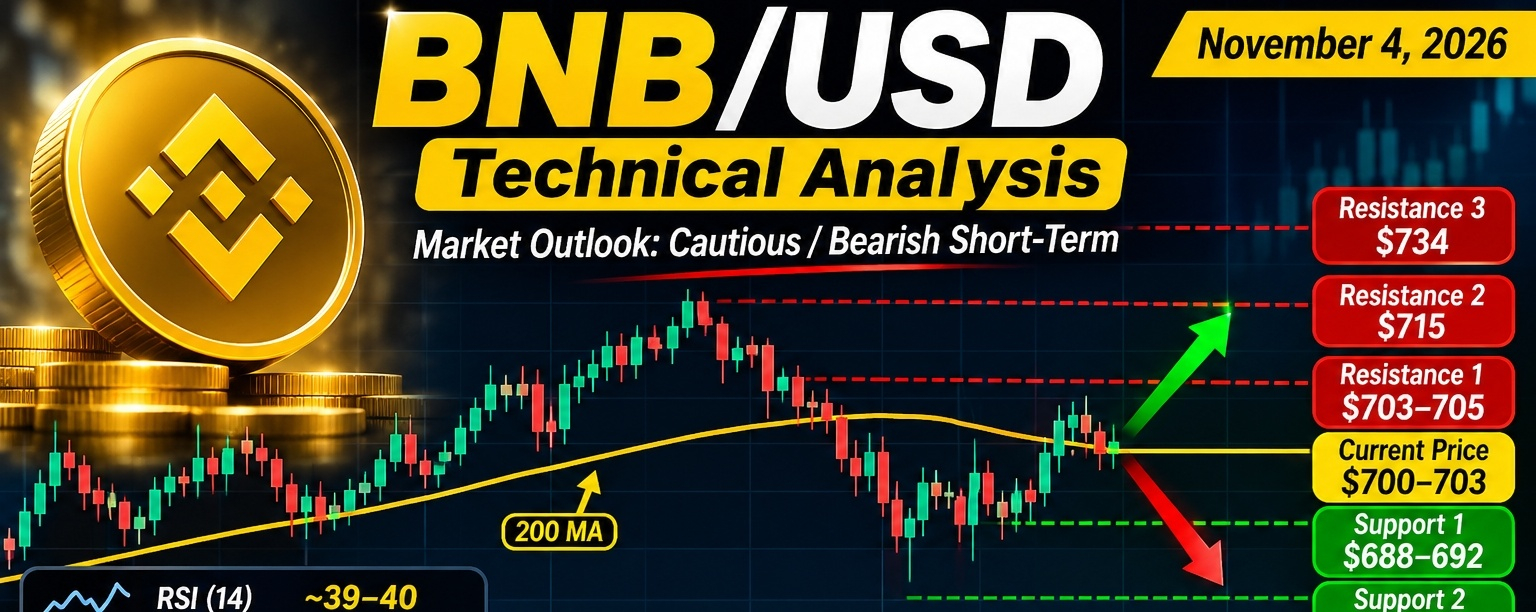

$BNB /USD Technical Analysis — November 4, 2026
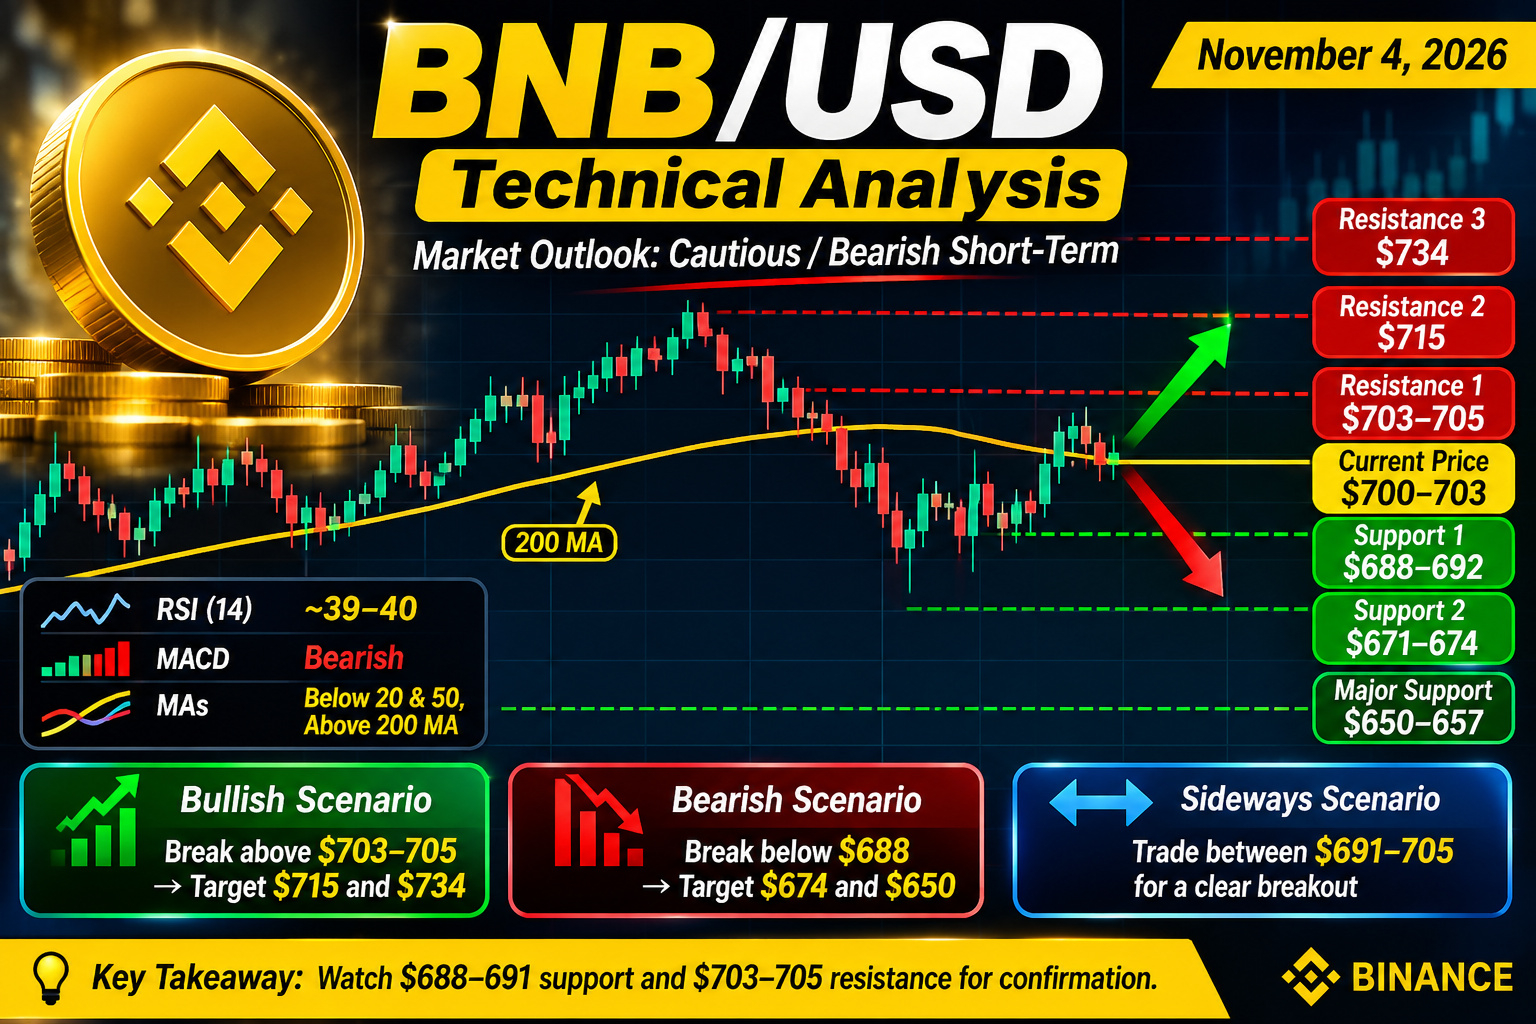
Market outlook: Short-term bearish · Medium-term cautious · Volatility elevated

$BNB /USD is trading around $700–$703 based on market data available for November 4, 2026. The price is showing weakness after a recent pullback, although BNB remains above its 200-day moving average. The key question is whether buyers can defend support near $690 or whether sellers push the price toward lower levels. COINOTAG +2
### 1\. Key support and resistance levels
| Level | Price (USD) | Significance |
| ------------------ | ----------- | ------------------------- |
| Resistance 3 | $734 | Stronger recovery target |
| Resistance 2 | $715 | Major resistance |
| Resistance 1 | $703–705 | Immediate resistance |
| Current price area | $700–703 | Decision zone |
| Support 1 | $688–692 | Immediate support |
| Support 2 | $671–674 | Secondary support |
| Major support | $650–657 | Longer-term trend support |
These are technical reference levels, not guaranteed turning points. COINOTAG +2
### 2\. Technical indicators
* RSI (14): approximately 39–40. Momentum is weak, but the daily RSI has not reached the usual oversold threshold of 30. COINOTAG +1
* MACD: Bearish, with the MACD below its signal line, suggesting downside momentum remains a concern. COINOTAG +1
* Moving averages: $BNB is below its 20-day and 50-day averages but remains above its 200-day average, indicating short-term weakness within a potentially intact longer-term structure. Sirius Investors +1
### 3\. Trading scenarios
Bullish scenario
If BNB breaks above $703–705 and holds that area, a move toward $715 becomes possible. A stronger breakout could open the way toward $734.
Bearish scenario
If BNB fails to hold $688–691, downside pressure could increase toward $674, followed by the $650–657 support zone.
Sideways scenario
If price remains between roughly $691 and $705, BNB could consolidate while traders wait for a clearer breakout direction.
### 4\. My market outlook
Cautious / bearish short-term
BNB currently has weaker short-term momentum than its longer-term trend. I would watch the $688–691 support area and the $703–705 resistance zone for confirmation before considering a trade.
* Potential bullish confirmation: A sustained move above $705.
* Potential bearish confirmation: A decisive break below $688.
* Risk management: Avoid chasing sudden price movements, and define your stop-loss before entering a trade.
This is technical analysis, not a guarantee of future price movement or financial advice. Cryptocurrency
markets are volatile, and leverage can magnify losses.