LYN Doubles Off the Lows and Keeps Climbing: Healthy Trend or Overextended?
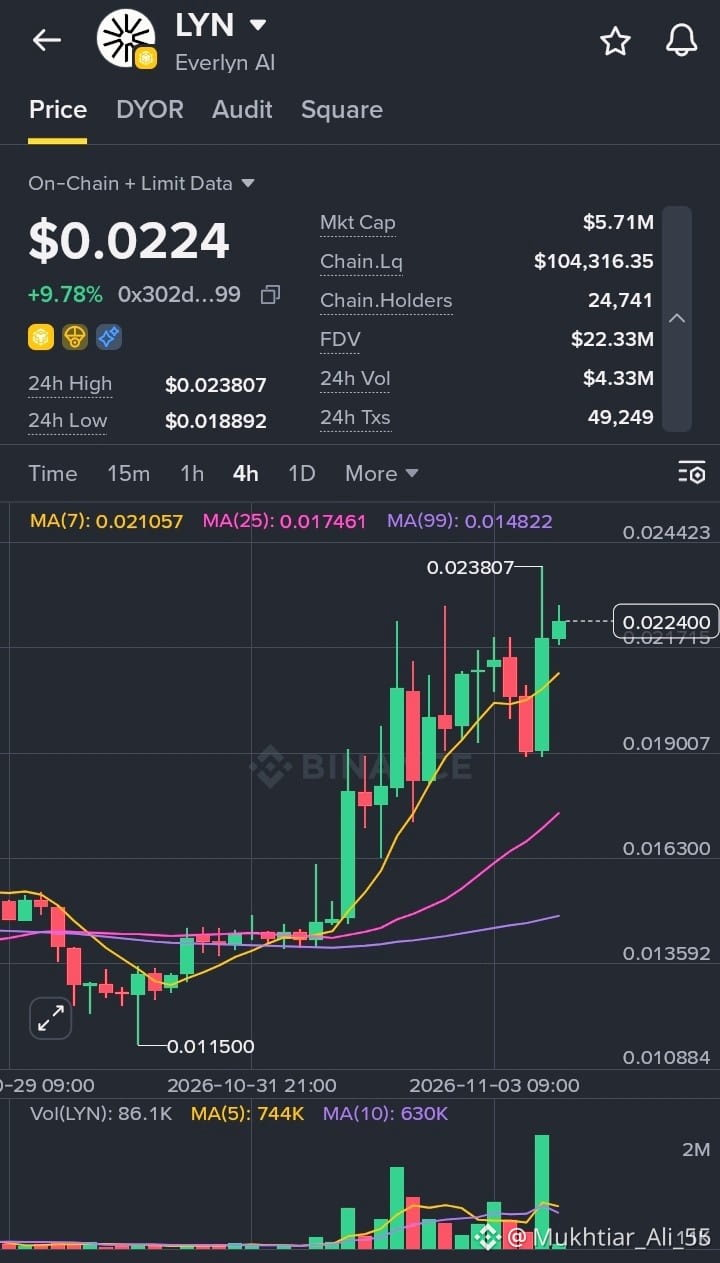
Everlyn AI (LYN) is trading around $0.0224, up 9.78% on the day, and the 4H chart shows a strong, well-structured uptrend.
After bottoming near $0.011500, price broke out of a flat base and has been printing higher highs and higher lows ever since. The latest push tagged $0.023807 before a small pullback, and buyers are already stepping back in near the top of the range.
What the chart is showing:
24h range: $0.018892 to $0.023807
24h volume: about $4.33M, with 49.2K transactions
Market cap: $5.71M, FDV: $22.33M
On-chain liquidity: about $104.3K, with roughly 24.7K holders
MA(7): 0.021057, rising steeply and sitting just below price as dynamic support
MA(25): 0.017461 and MA(99): 0.014822, both sloping up and well below price, a clean bullish stack
Volume: the latest green candle came with the biggest volume bar on the chart, and the MA(5) is above the MA(10), which supports the move
My take: The structure here is strong. Higher lows, rising averages, and volume expanding on the breakout all point to genuine buying interest. That said, price has moved nearly 100% off the bottom and is now stretched far above the MA(25), so a pullback toward the MA(7) near $0.021 would be normal and could offer a better entry than buying the highs. A clean 4H close above $0.023807 would confirm continuation, while a break under $0.021 could send price toward the $0.019 area.
Also worth noting, on-chain liquidity is very thin at around $104K, which is tiny compared to the daily volume. That means slippage and sudden swings can be severe in both directions, so position sizing matters a lot on a token like this. I’m watching how it handles the next dip rather than chasing strength.
#EverlynAI #LYN #CryptoAnalysis #TechnicalAnalysis #Altcoins
$LYN
Everlyn AI (LYN) is trading around $0.0224, up 9.78% on the day, and the 4H chart shows a strong, well-structured uptrend.
After bottoming near $0.011500, price broke out of a flat base and has been printing higher highs and higher lows ever since. The latest push tagged $0.023807 before a small pullback, and buyers are already stepping back in near the top of the range.
What the chart is showing:
24h range: $0.018892 to $0.023807
24h volume: about $4.33M, with 49.2K transactions
Market cap: $5.71M, FDV: $22.33M
On-chain liquidity: about $104.3K, with roughly 24.7K holders
MA(7): 0.021057, rising steeply and sitting just below price as dynamic support
MA(25): 0.017461 and MA(99): 0.014822, both sloping up and well below price, a clean bullish stack
Volume: the latest green candle came with the biggest volume bar on the chart, and the MA(5) is above the MA(10), which supports the move
My take: The structure here is strong. Higher lows, rising averages, and volume expanding on the breakout all point to genuine buying interest. That said, price has moved nearly 100% off the bottom and is now stretched far above the MA(25), so a pullback toward the MA(7) near $0.021 would be normal and could offer a better entry than buying the highs. A clean 4H close above $0.023807 would confirm continuation, while a break under $0.021 could send price toward the $0.019 area.
Also worth noting, on-chain liquidity is very thin at around $104K, which is tiny compared to the daily volume. That means slippage and sudden swings can be severe in both directions, so position sizing matters a lot on a token like this. I’m watching how it handles the next dip rather than chasing strength.
#EverlynAI #LYN #CryptoAnalysis #TechnicalAnalysis #Altcoins
$LYN