$BTC $SAGA $DEXE
Here is the current technical analysis for Bitcoin (BTC/USD):
1. Key Technical Levels & Chart Analysis
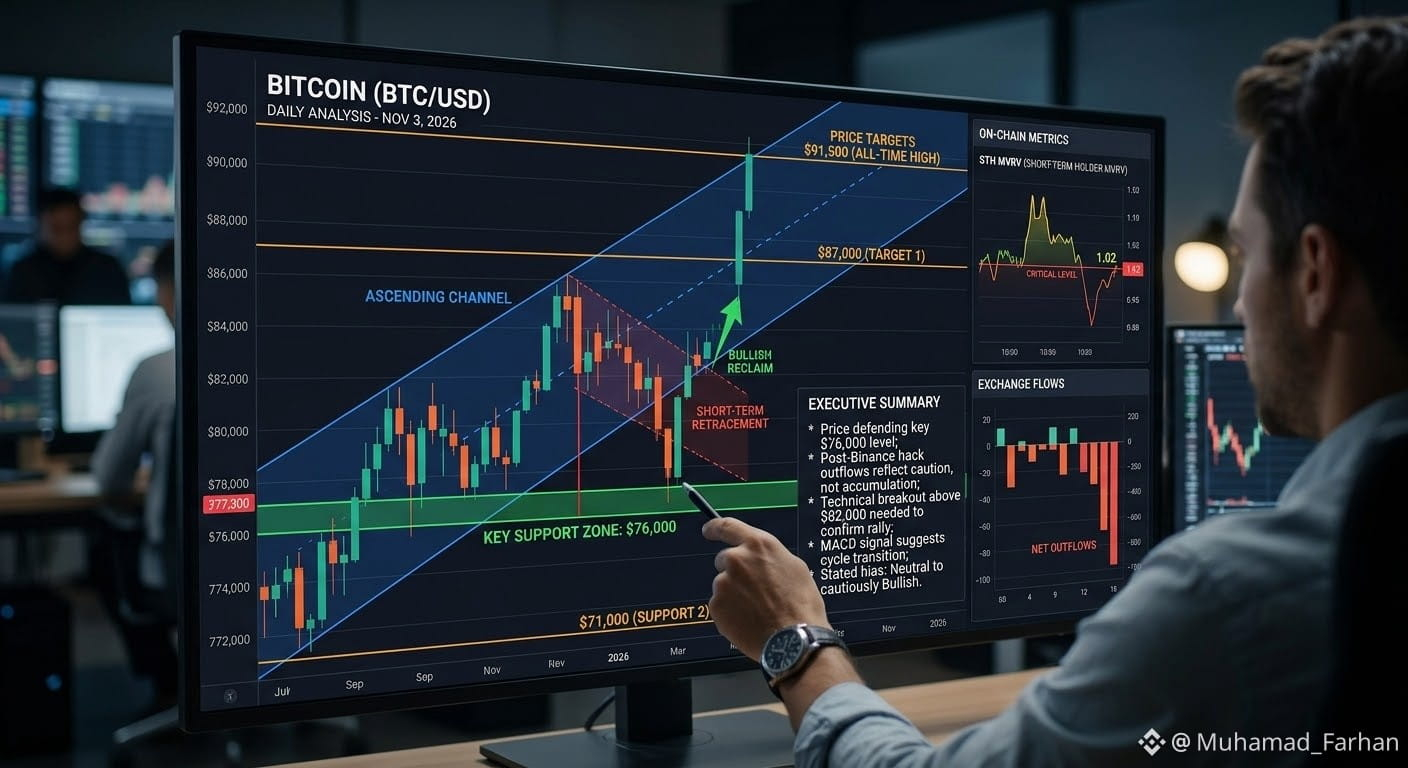
Current Price Action: BTC is hovering in the $77,400 – $77,600 range, rebounding slightly off recent lower test areas near $76,000.
Primary Trend: BTC has been trading within a broader Ascending Channel established over the past few months.
Key Support Zone ($76,000): This level remains the critical short-term floor. A daily close below $76,000 would risk invalidating the channel structure and opening a secondary support target around $71,000.
Resistance & Breakout Targets:
Immediate Resistance / Target 1: $82,000 – $87,000 zone. A clear reclamation above $82,000 is needed to confirm the continuation of the bullish rally.
Target 2 (All-Time High Re-test): $91,500.
2. On-Chain & Market Drivers
Exchange Outflows & Sentiment: Recent market headlines (including exchange security concerns) have driven heavy net outflows from major trading platforms. These outflows currently reflect investor caution rather than aggressive long accumulation.
Short-Term Holder MVRV (STH-MVRV): Holding around critical thresholds (~1.02), signalling that short-term traders are roughly at break-even, which often precedes significant volatility or a directional break.
MACD & Momentum: Momentum indicators suggest a transition period where neutral-to-cautiously bullish buyers are attempting a short-term reclaim off support.
3. Summary & Strategic Outlook
Bias: Neutral to Cautiously Bullish while holding above $76,000.
Bullish Case: Defending $76,000 and pushing back above $82,000 validates a channel bounce, targeting $87,000 and $91,500.
Bearish Case: A breakdown below $76,000 signals further retracement toward $71,000.
#USMidtermElections #USOctoberNFP-AreRateCutsStillPossible #BinanceReopensWithdrawalsForMoreAssets #AppleReportsMixedResults #BinanceHourlyDepositsExceedWithdrawals
Here is the current technical analysis for Bitcoin (BTC/USD):
1. Key Technical Levels & Chart Analysis
Current Price Action: BTC is hovering in the $77,400 – $77,600 range, rebounding slightly off recent lower test areas near $76,000.
Primary Trend: BTC has been trading within a broader Ascending Channel established over the past few months.
Key Support Zone ($76,000): This level remains the critical short-term floor. A daily close below $76,000 would risk invalidating the channel structure and opening a secondary support target around $71,000.
Resistance & Breakout Targets:
Immediate Resistance / Target 1: $82,000 – $87,000 zone. A clear reclamation above $82,000 is needed to confirm the continuation of the bullish rally.
Target 2 (All-Time High Re-test): $91,500.
2. On-Chain & Market Drivers
Exchange Outflows & Sentiment: Recent market headlines (including exchange security concerns) have driven heavy net outflows from major trading platforms. These outflows currently reflect investor caution rather than aggressive long accumulation.
Short-Term Holder MVRV (STH-MVRV): Holding around critical thresholds (~1.02), signalling that short-term traders are roughly at break-even, which often precedes significant volatility or a directional break.
MACD & Momentum: Momentum indicators suggest a transition period where neutral-to-cautiously bullish buyers are attempting a short-term reclaim off support.
3. Summary & Strategic Outlook
Bias: Neutral to Cautiously Bullish while holding above $76,000.
Bullish Case: Defending $76,000 and pushing back above $82,000 validates a channel bounce, targeting $87,000 and $91,500.
Bearish Case: A breakdown below $76,000 signals further retracement toward $71,000.
#USMidtermElections #USOctoberNFP-AreRateCutsStillPossible #BinanceReopensWithdrawalsForMoreAssets #AppleReportsMixedResults #BinanceHourlyDepositsExceedWithdrawals