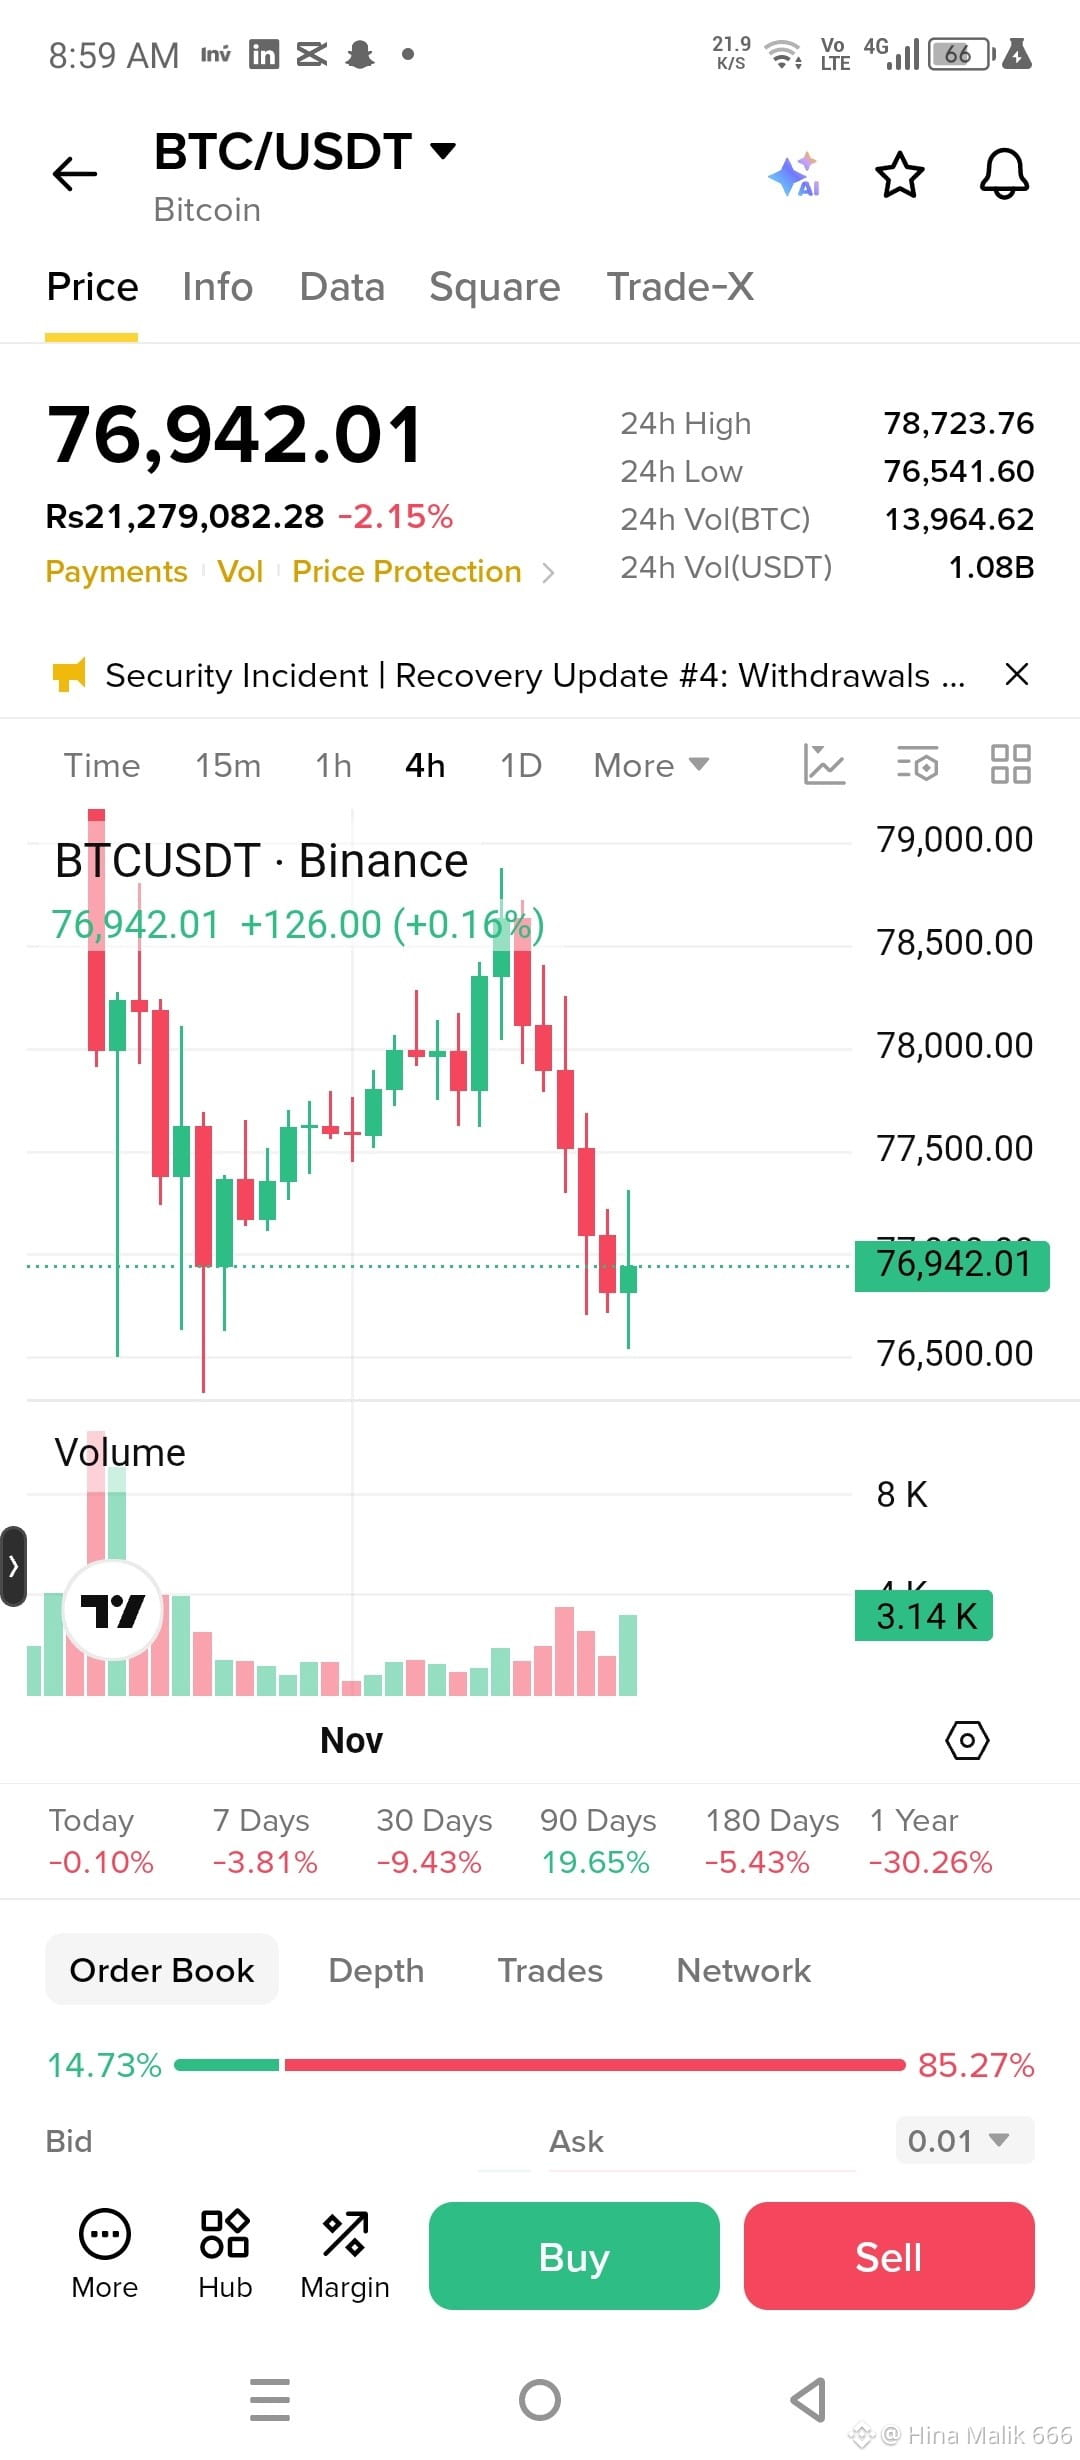
📉 $BTC BTC/USDT — BEARISH | 4H Analysis
Bitcoin is facing strong selling pressure!
$BTC
is currently trading around $76,942, down 2.15% in the last 24 hours.
What does the 4H chart tell us?
🔴 Strong rejection from the $78,500 area.
🔴 Consecutive bearish candles indicate seller dominance.
🔴 Price is testing an important support zone near $76,500.
Key Levels to Watch:
Support: $76,500
Resistance: $77,300
Major Resistance: $77,800
My Trading View:
If$BTC breaks below $76,500 with strong candle confirmation, further downside could follow.
However, if buyers defend this support and reclaim $77,300, a short-term recovery may develop.
⚠️ Always wait for confirmation and manage your risk.
Question for Traders:
Will BTC break below $76,500, or can buyers defend this support?
Share your thoughts! 👇
#BTC☀️ #Bitcoin #TechnicalAnalysiss #CryptoTrading. #BinanceSquare
Bitcoin is facing strong selling pressure!
$BTC
is currently trading around $76,942, down 2.15% in the last 24 hours.
What does the 4H chart tell us?
🔴 Strong rejection from the $78,500 area.
🔴 Consecutive bearish candles indicate seller dominance.
🔴 Price is testing an important support zone near $76,500.
Key Levels to Watch:
Support: $76,500
Resistance: $77,300
Major Resistance: $77,800
My Trading View:
If$BTC breaks below $76,500 with strong candle confirmation, further downside could follow.
However, if buyers defend this support and reclaim $77,300, a short-term recovery may develop.
⚠️ Always wait for confirmation and manage your risk.
Question for Traders:
Will BTC break below $76,500, or can buyers defend this support?
Share your thoughts! 👇
#BTC☀️ #Bitcoin #TechnicalAnalysiss #CryptoTrading. #BinanceSquare