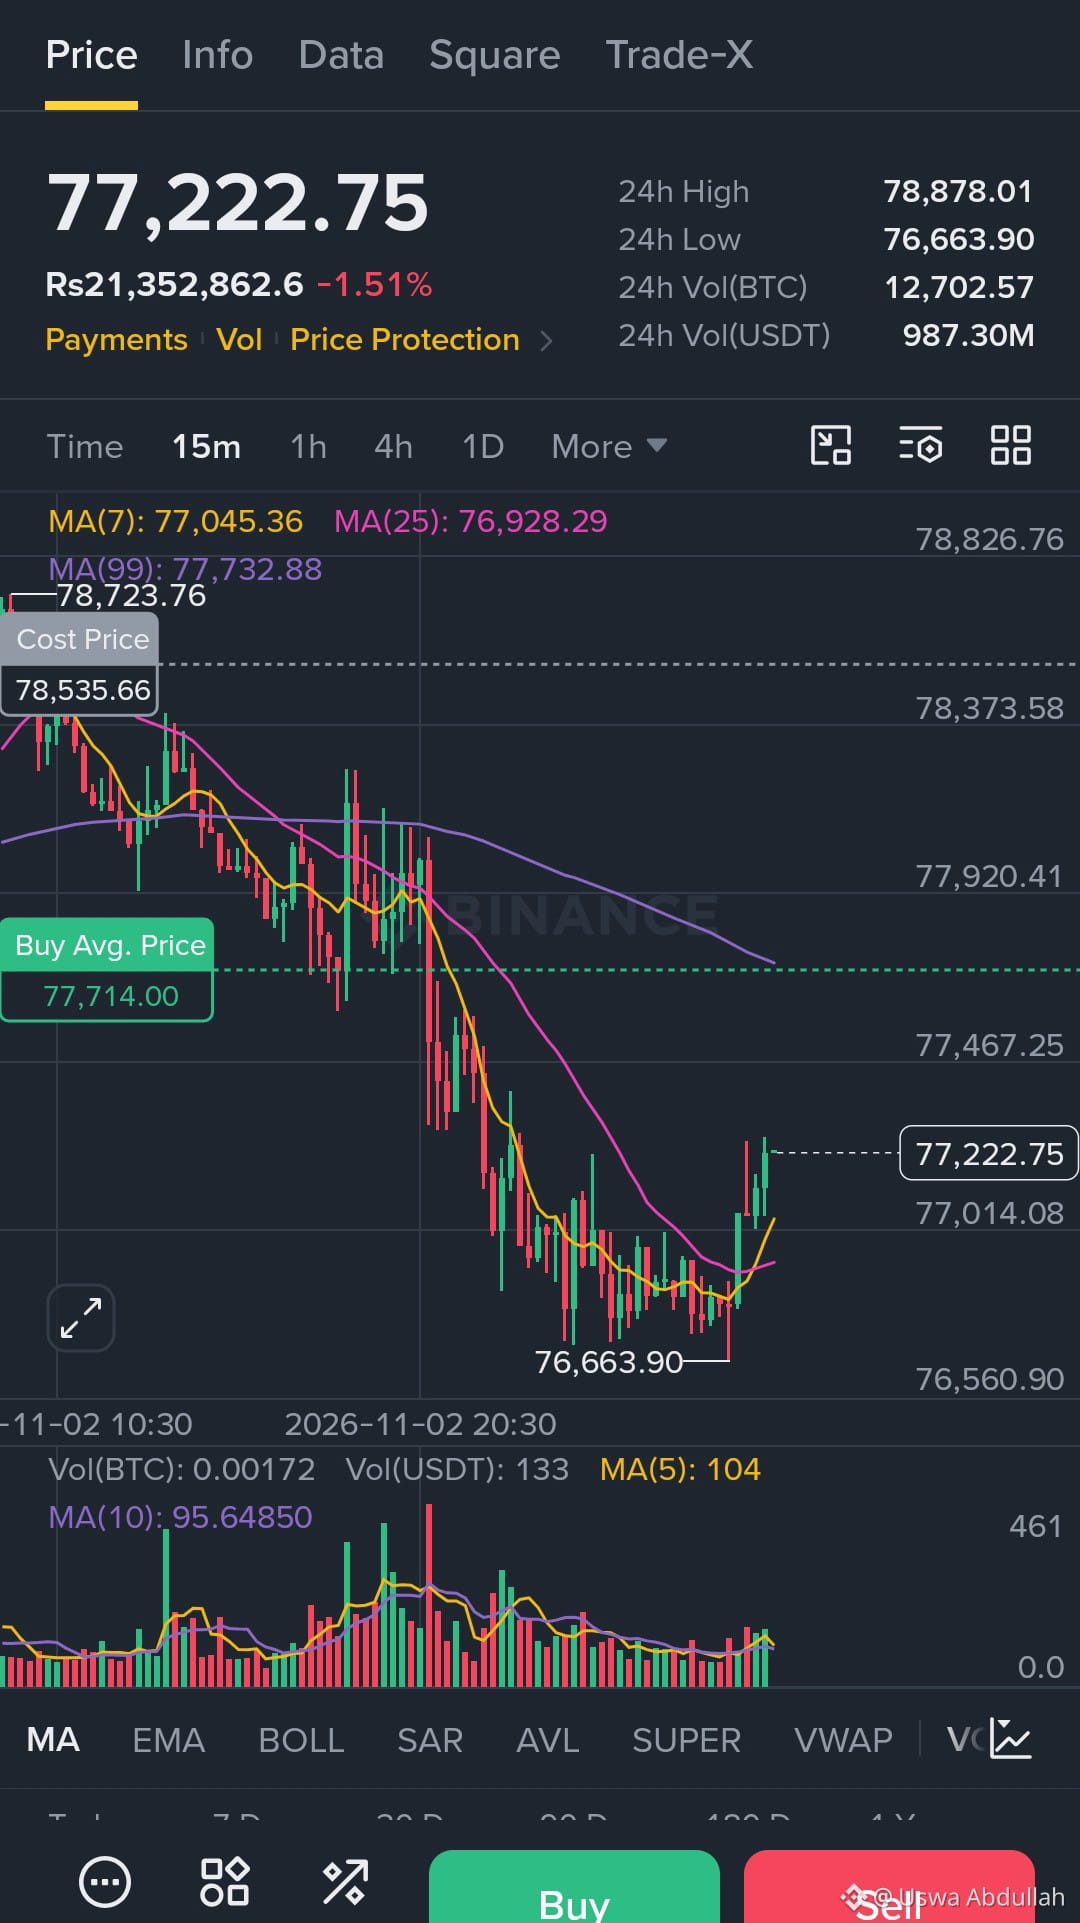
😎₿ #Bitcoin❗ ($BTC ) Short Analysis — 3 November 2026🚀🚀🔥
#USMidtermElections #BinanceWithdrawalScamWarning
Market outlook: $BTC price prediction and trading strategy
Bitcoin remains one of the most closely watched crypto assets. For today's analysis, the key is to identify whether BTC is showing bullish momentum or facing selling pressure near resistance.
Short-term bearish bias
$BTC Market Overview
Bitcoin is trading around the $76,000–$78,000 region, with sellers still applying pressure. Recent analysis identifies $76,000–$76,500 as an important support zone, while $80,000–$82,000 is a major resistance area. Borearis +2
Key Price Levels
| Level | BTC Price (USD) |
| -------------- | --------------- |
| Resistance 2 | $80,000–$82,000 |
| Resistance 1 | $78,500–$79,000 |
| Support 1 | $76,000–$76,500 |
| Support 2 | $74,000–$75,000 |
| Major downside | $73,000 |
BTC Price Predictions
Bearish scenario
$74,000–$75,000
If #BTC☀ breaks below $76,000 with strong selling volume, further downside may follow.
Bullish scenario
$80,000–$82,000
A strong breakout above $79,000 could support a recovery toward $80,000–$82,000.
Neutral scenario
$76,000–$79,000
BTC may continue moving sideways while traders wait for a breakout.
### BTC Short Trade Setup (Educational)
| Trade Detail | Price |
| -------------- | --------------- |
| Entry zone | $78,000–$78,500 |
| Stop Loss (SL) | $79,300 |
| Take Profit 1 | $77,000 |
| Take Profit 2 | $76,500 |
| Take Profit 3 | $75,000 |
Trade confirmation: Consider a short only after rejection near resistance and confirmation of bearish momentum. Avoid entering blindly.
Final Market View
BTC is showing short-term weakness, but $76,000 remains a critical support level. A breakdown could increase selling pressure, while a recovery above $79,000 would weaken the bearish outlook.
#USMidtermElections #BinanceWithdrawalScamWarning
Market outlook: $BTC price prediction and trading strategy
Bitcoin remains one of the most closely watched crypto assets. For today's analysis, the key is to identify whether BTC is showing bullish momentum or facing selling pressure near resistance.
Short-term bearish bias
$BTC Market Overview
Bitcoin is trading around the $76,000–$78,000 region, with sellers still applying pressure. Recent analysis identifies $76,000–$76,500 as an important support zone, while $80,000–$82,000 is a major resistance area. Borearis +2
Key Price Levels
| Level | BTC Price (USD) |
| -------------- | --------------- |
| Resistance 2 | $80,000–$82,000 |
| Resistance 1 | $78,500–$79,000 |
| Support 1 | $76,000–$76,500 |
| Support 2 | $74,000–$75,000 |
| Major downside | $73,000 |
BTC Price Predictions
Bearish scenario
$74,000–$75,000
If #BTC☀ breaks below $76,000 with strong selling volume, further downside may follow.
Bullish scenario
$80,000–$82,000
A strong breakout above $79,000 could support a recovery toward $80,000–$82,000.
Neutral scenario
$76,000–$79,000
BTC may continue moving sideways while traders wait for a breakout.
### BTC Short Trade Setup (Educational)
| Trade Detail | Price |
| -------------- | --------------- |
| Entry zone | $78,000–$78,500 |
| Stop Loss (SL) | $79,300 |
| Take Profit 1 | $77,000 |
| Take Profit 2 | $76,500 |
| Take Profit 3 | $75,000 |
Trade confirmation: Consider a short only after rejection near resistance and confirmation of bearish momentum. Avoid entering blindly.
Final Market View
BTC is showing short-term weakness, but $76,000 remains a critical support level. A breakdown could increase selling pressure, while a recovery above $79,000 would weaken the bearish outlook.