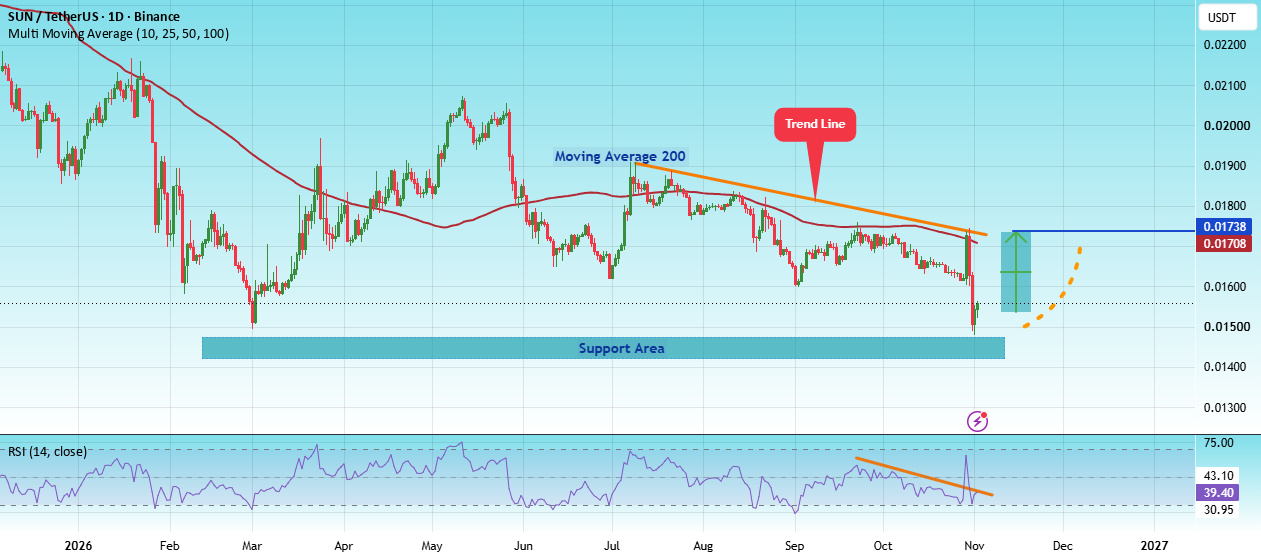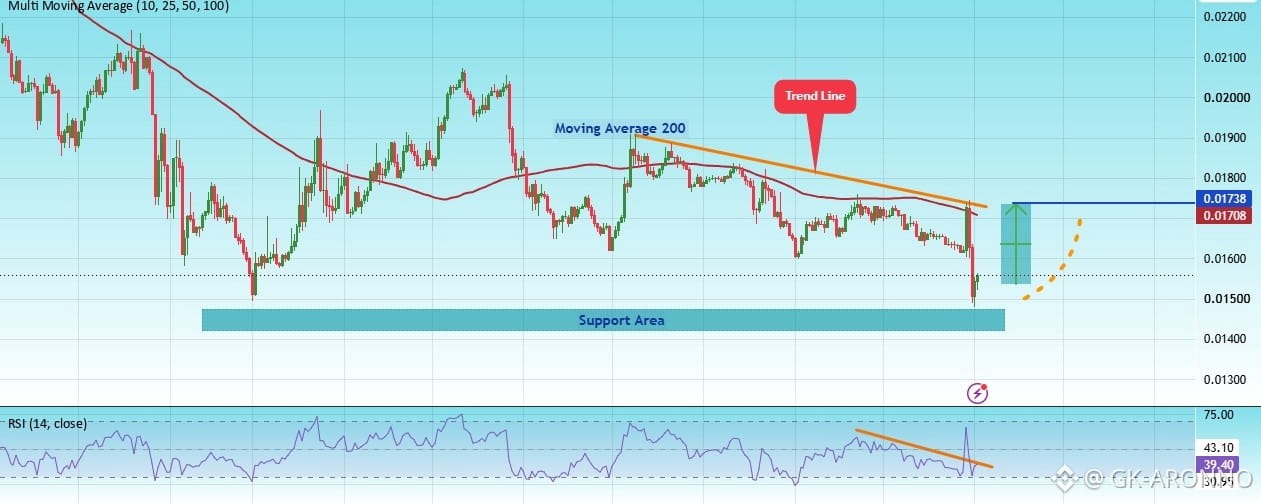


The price is currently trading below a major descending trendline on the daily timeframe. This trendline has demonstrated clear technical strength, acting as a dynamic resistance level from which the price has repeatedly faced rejection, highlighting its significance in determining the asset's current price direction.
Recently, the price reached a major support zone at 0.01400, where buying pressure emerged and triggered an initial rebound. This reaction supports the possibility of further recovery, with the descending trendline at 0.01738 representing the first upside target.
This target carries additional technical significance as it aligns with the 200 Moving Average (MA200), which also acts as dynamic resistance. Therefore, a successful breakout above this level would be an important factor in confirming a potential shift toward a bullish market structure.
It is also worth noting that the current price range has served as a consolidation zone since March 2026, with the price continuing to trade within this range. This highlights the technical significance of the zone and strengthens the possibility of a continued rebound toward the descending trendline for a potential retest.
Bearish Invalidation Level
The bullish scenario will be invalidated if the price breaks below the major support level at 0.01400, with two consecutive candle closes below this level. Such a move would indicate weakening buying pressure and increase the likelihood of further downside.
Technical Outlook
Current technical indicators suggest the potential for a price rebound toward 0.01738, provided the price maintains its stability above the key support zone at 0.01400.
The descending trendline and the 200 Moving Average remain the primary resistance levels to watch. The price reaction around these levels will be crucial in determining whether the current movement remains a corrective rebound or develops into a potential trend reversal.