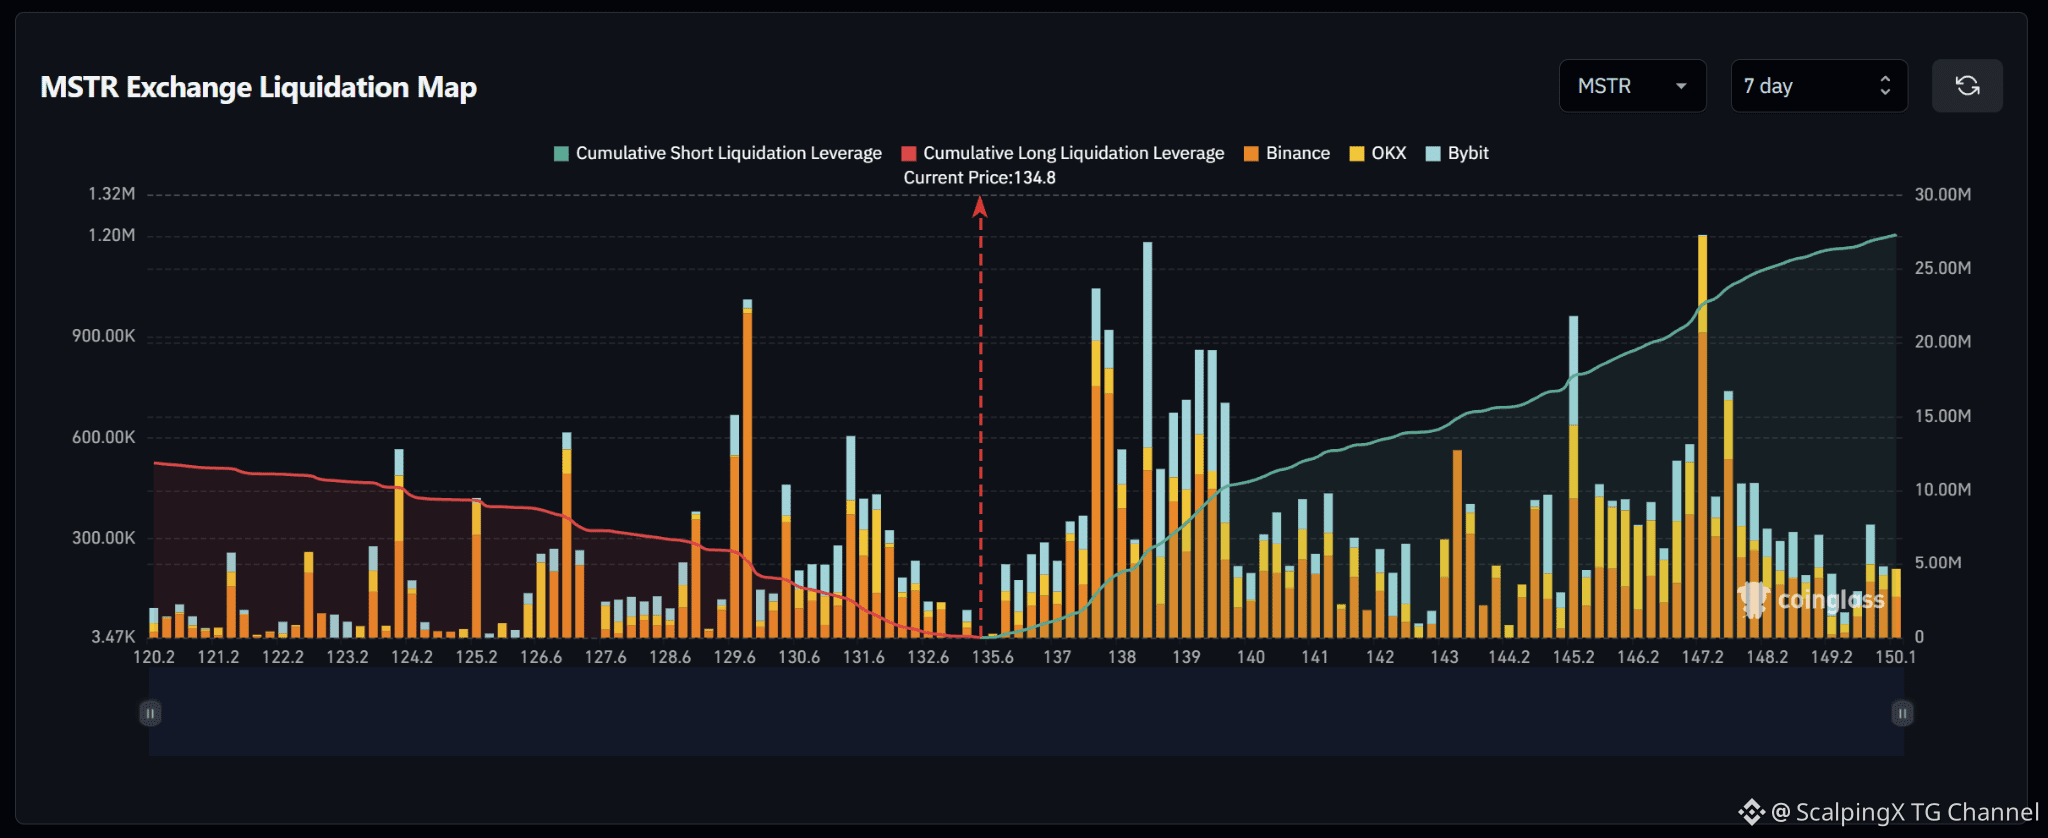
$MSTR – Liquidation Map (7 days) – Index ~134.8
🧭 The preferred scenario is an upside short sweep. The dense liquidation band at 137.5–139.6 sits closer to price than the major short clusters around 145–148. Estimated cumulative short liquidation exposure reaches roughly $27 million across the displayed range, more than twice the long side.
🔺 A break and hold above 137 brings 137.5–138 into focus, followed by 138.3–139.6. Several large bars within this band could amplify an advance as short positions are liquidated.
🎯 Holding above 139.6 after the sweep would shift attention to 140–141.7 and 143–145.3. Farther up, 147–147.7 stands out, particularly near 147.2, with more scattered liquidation exposure between these clusters.
⚖️ Losing 134 without a reclaim would weaken the upside scenario and shift attention to long clusters at 131–132, then 129.5–130. The bar near 129.8 is the most prominent below price. Avoid chasing a sweep of 137.5–139.6 that quickly reverses below 137.
#LiquidationMap
🧭 The preferred scenario is an upside short sweep. The dense liquidation band at 137.5–139.6 sits closer to price than the major short clusters around 145–148. Estimated cumulative short liquidation exposure reaches roughly $27 million across the displayed range, more than twice the long side.
🔺 A break and hold above 137 brings 137.5–138 into focus, followed by 138.3–139.6. Several large bars within this band could amplify an advance as short positions are liquidated.
🎯 Holding above 139.6 after the sweep would shift attention to 140–141.7 and 143–145.3. Farther up, 147–147.7 stands out, particularly near 147.2, with more scattered liquidation exposure between these clusters.
⚖️ Losing 134 without a reclaim would weaken the upside scenario and shift attention to long clusters at 131–132, then 129.5–130. The bar near 129.8 is the most prominent below price. Avoid chasing a sweep of 137.5–139.6 that quickly reverses below 137.
#LiquidationMap