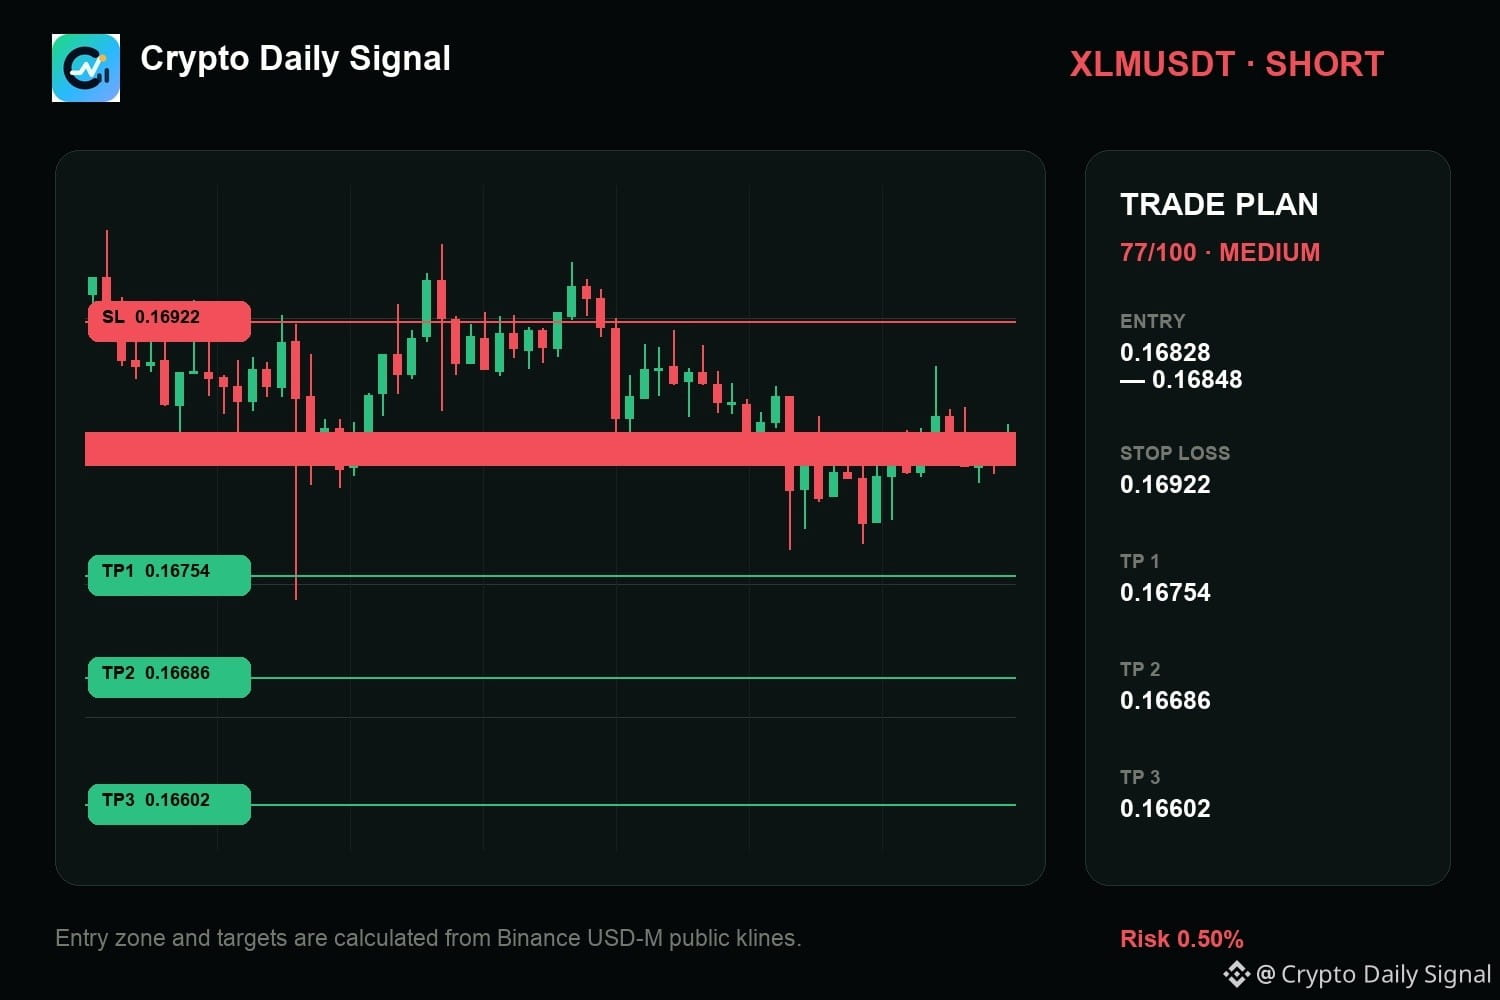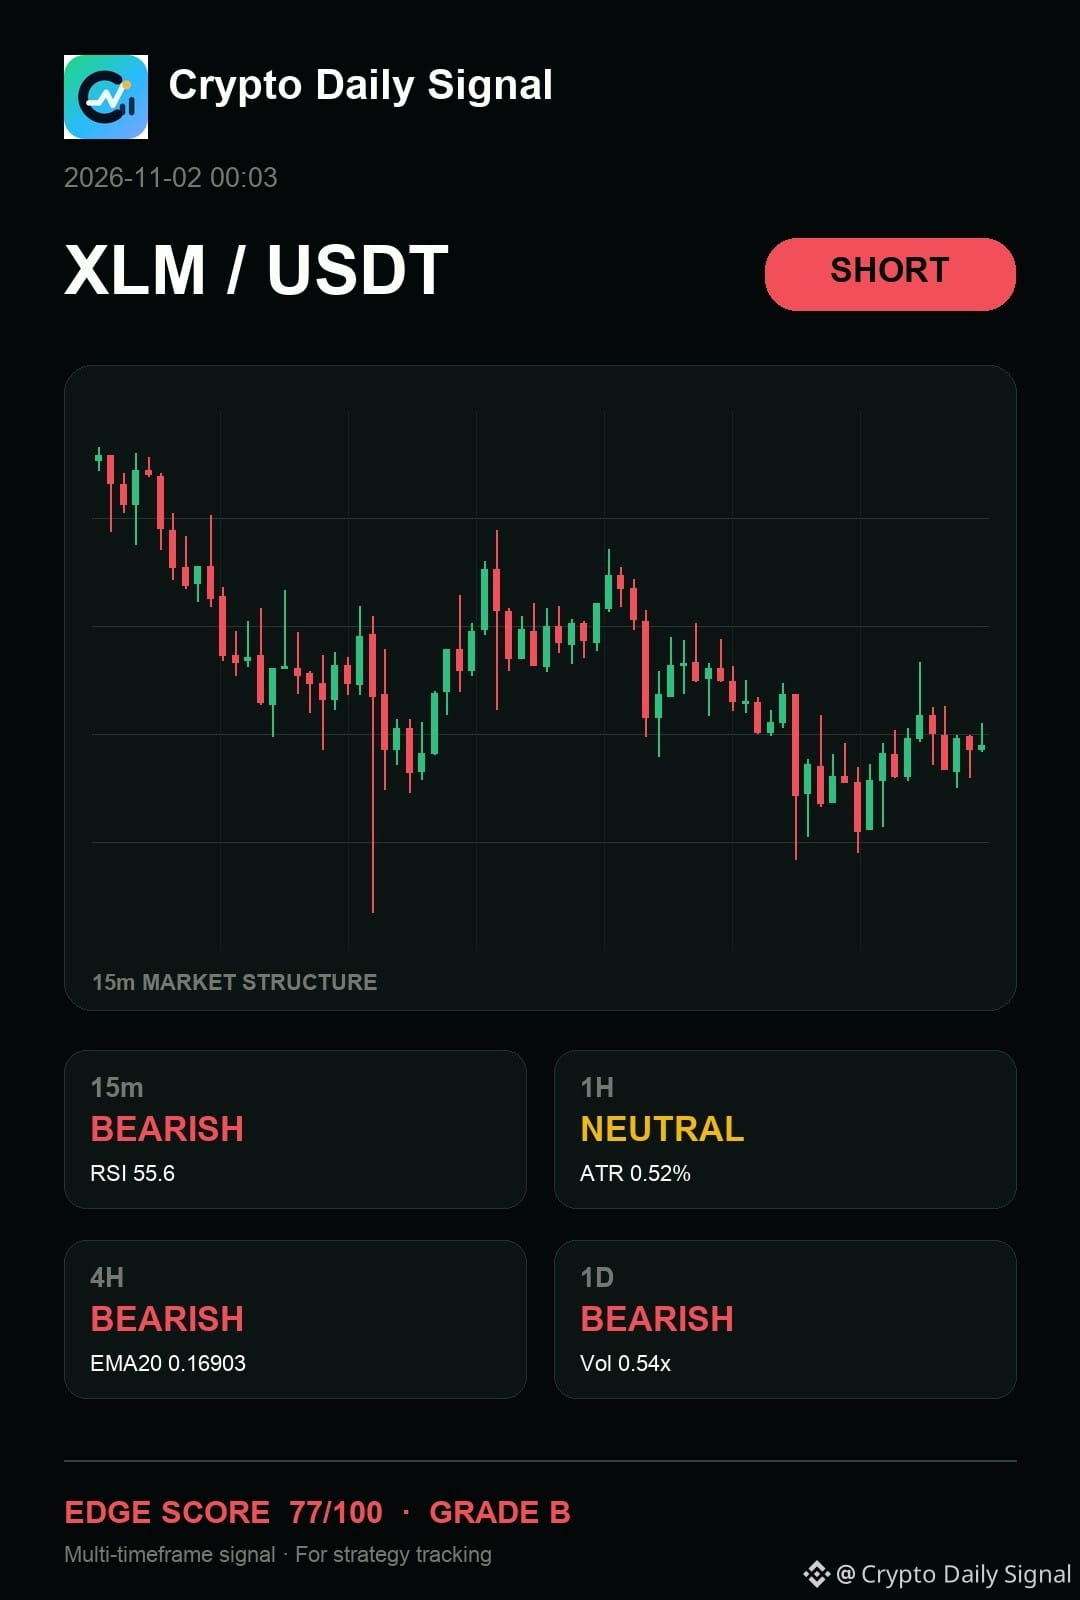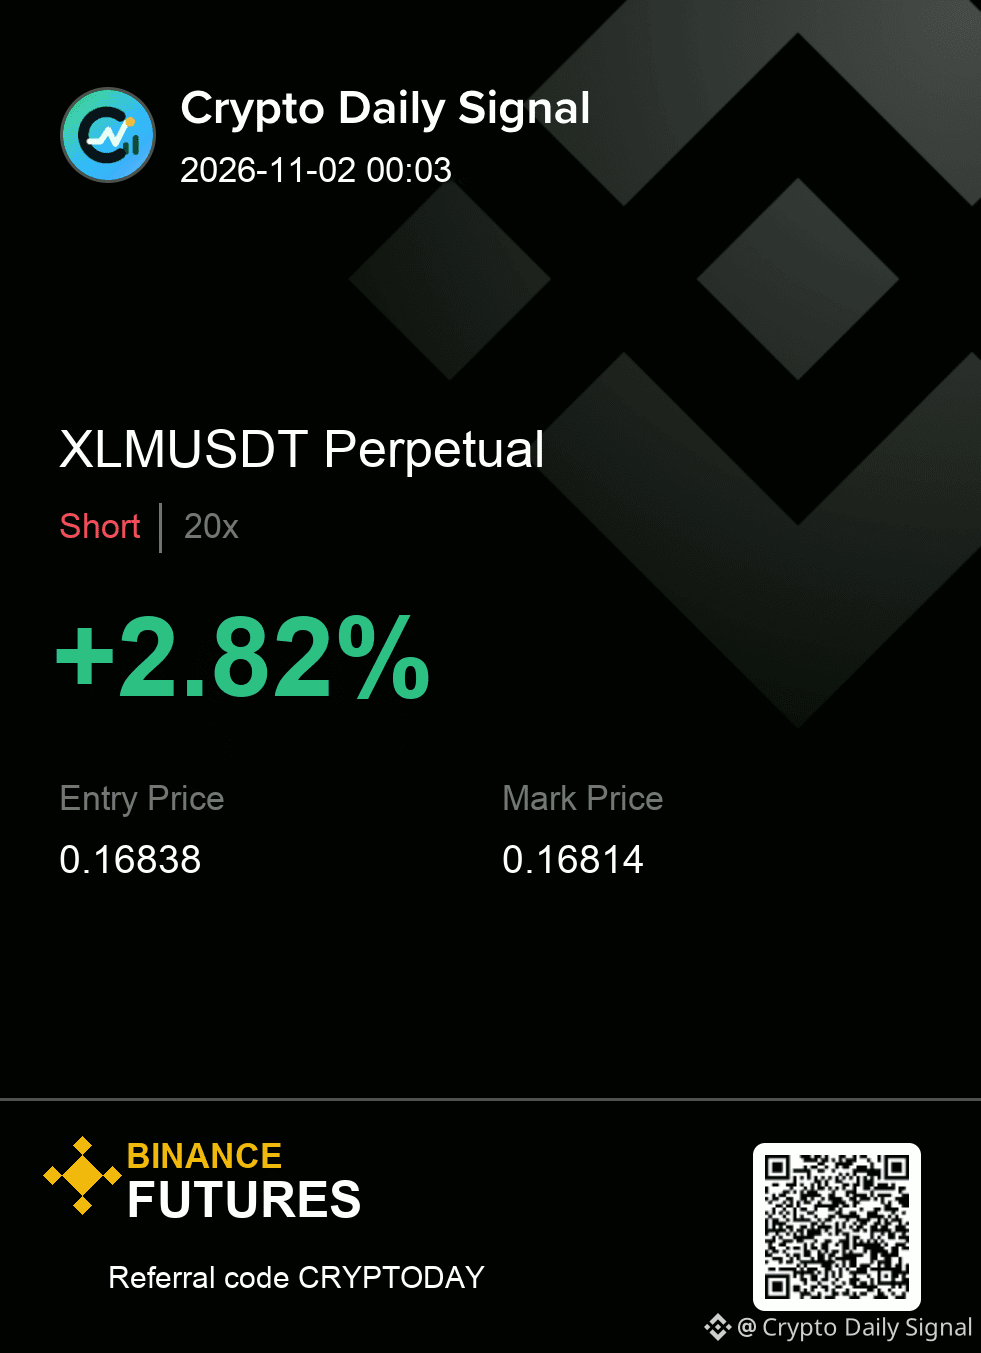
$XLM has my attention on the sell side because the price action shows lower highs forming against the current range. The broader trend leans bearish across the daily and four-hour views, making this downside continuation plausible. A break below the consolidation floor on a down candle would solidify this view.
Levels — XLMUSDT
Zone: 0.16828 - 0.16848
Cut: 0.16922
Scale: 0.16754 | 0.16686 | 0.16602
#TradingSignal
Levels — XLMUSDT
Zone: 0.16828 - 0.16848
Cut: 0.16922
Scale: 0.16754 | 0.16686 | 0.16602
#TradingSignal