AIN (Infinity Ground) Rockets 63% in a Day: Breakout or Blow-Off Top? A 4H Chart Breakdown
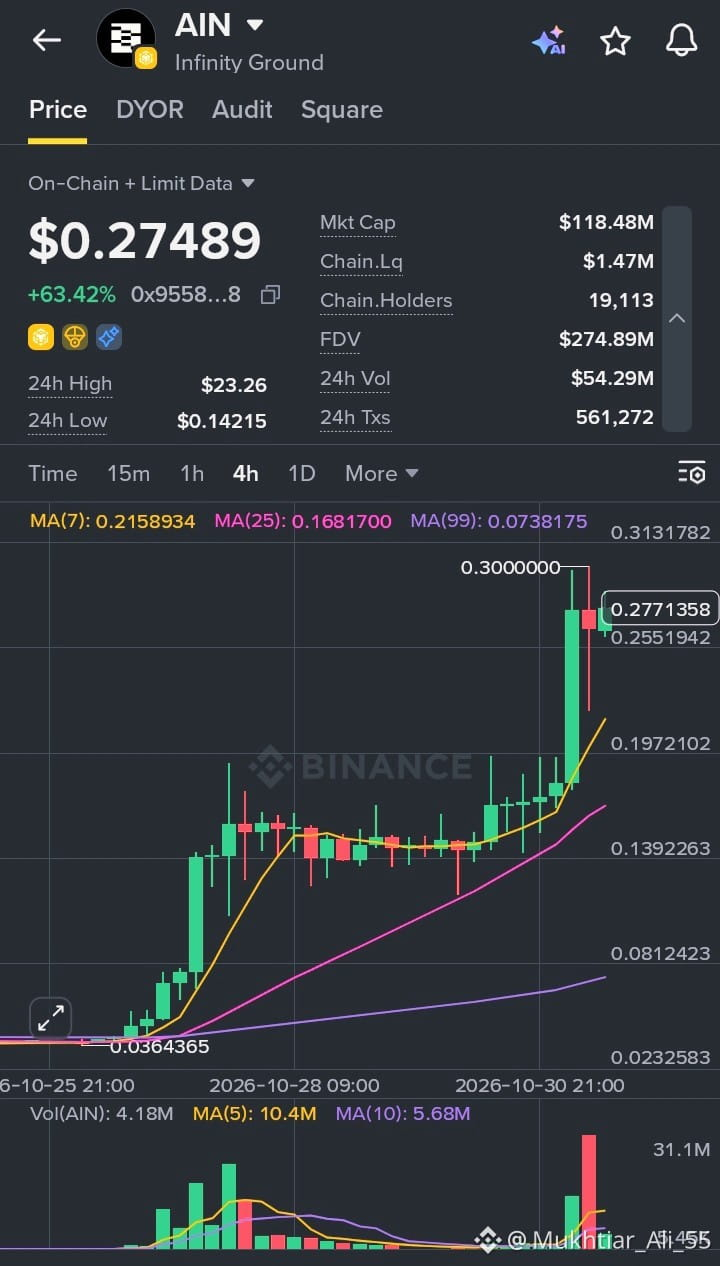
Infinity Ground (AIN) is one of the loudest movers on the board right now. The token is trading at $0.27489, up 63.42% on the day, after a long stretch of sideways action followed by a vertical move to a high of $0.30.
Looking at the 4H chart, the story is clear. AIN spent days building a base near $0.036, then made a first leg up and consolidated for a long period around $0.14 to $0.16. That quiet phase ended with a powerful breakout candle that pushed price above $0.25 in a single move, accompanied by the largest volume spike on the chart. The next candle printed a long upper wick near $0.30 and sold off before buyers stepped back in, which shows profit-taking is already happening at the highs.
The moving averages confirm the strength. MA(7) is at 0.2159, MA(25) at 0.1682 and MA(99) at 0.0738, all sloping upward and stacked in bullish order. But price is now stretched far above all of them, and that gap is exactly where pullbacks tend to start.
Key numbers worth noting:
Market cap: $118.48M | FDV: $274.89M
24h volume: $54.29M | 24h transactions: 561,272
On-chain holders: 19,113
On-chain liquidity: only $1.47M
That last figure matters. Liquidity of $1.47M against a $118M market cap is thin, which means large orders can move price sharply in both directions and exiting a position can be costly.
Levels I’m watching:
Support: $0.2551, then the MA(7) near $0.216, then the $0.197 area
Resistance: $0.30 (the recent high), then $0.3132
Also worth flagging: the 24h High on the page shows $23.26, which looks like a data glitch or a bad on-chain print, since the chart’s own high sits near $0.30. Double-check data like this before trading on it.
The trend is strongly bullish, but moves like this are fragile. Chasing a vertical candle is risky, and a healthy retest of the breakout zone would be a far better sign than another straight-line pump. Keep position sizes small and plan your exit before your entry.
#AIN #InfinityGround #CryptoTrading
$AIN