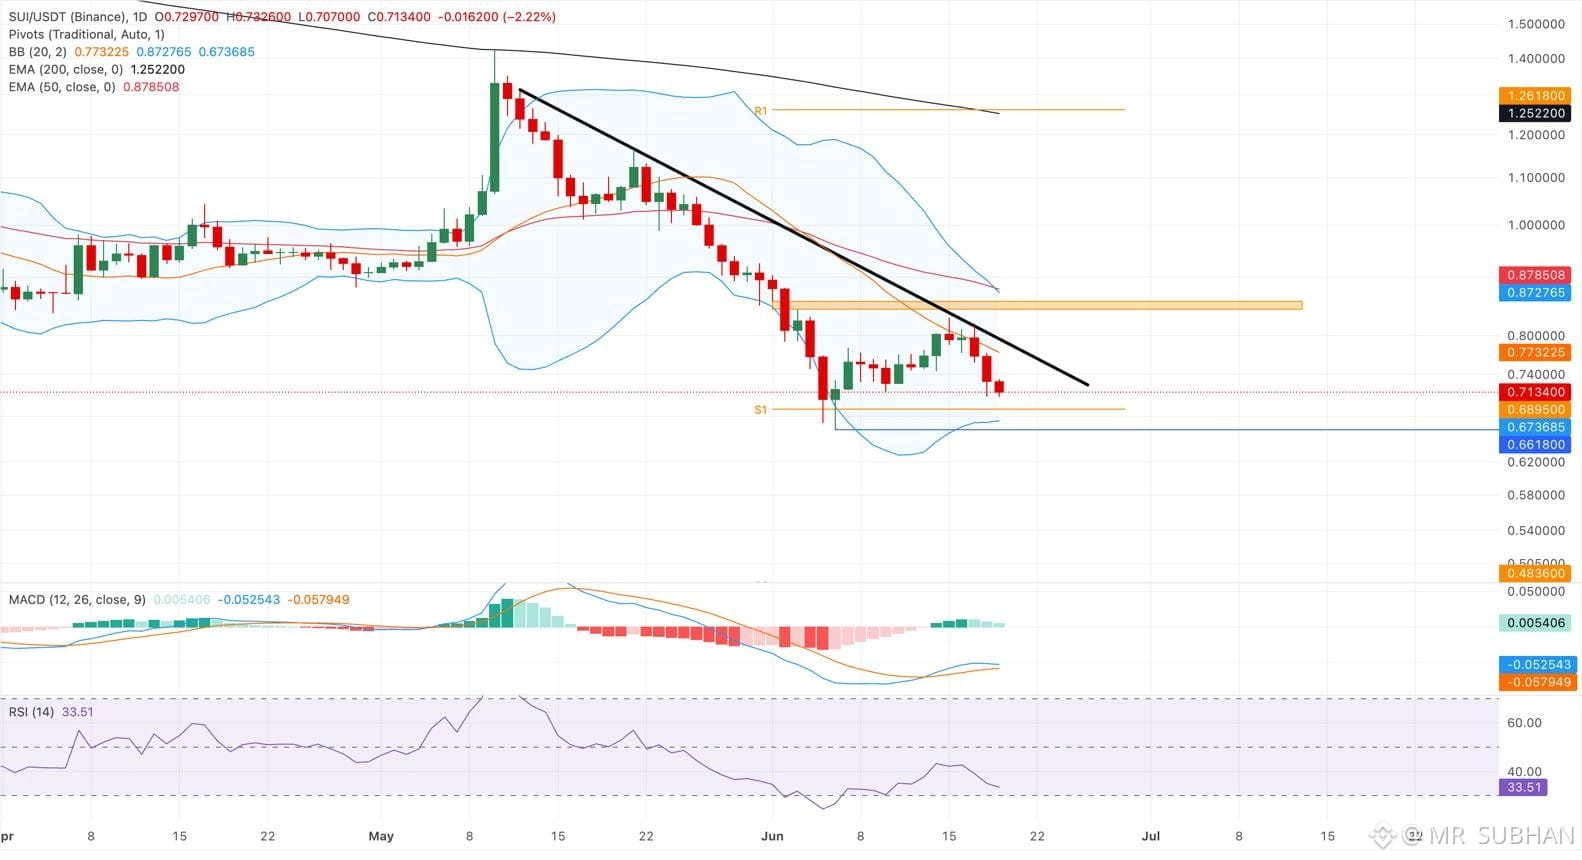
$SUI Will RECOVER ....
#USMidtermElections #KOSPIFalls3.53%BackBelow6000
Daily: Strong selling pressure, with price trading below major moving averages.
4H: Downtrend remains intact; sellers have control.
Short-term: A relief bounce is possible after the recent decline.
Volume: Elevated volatility means breakouts and breakdowns need confirmation.
The latest technical data shows a bearish daily trend, with RSI around 35–38, approaching oversold territory.
RSI (14)
Daily RSI is around 35–38. Selling pressure is strong, but a short-term bounce could develop.
Momentum remains weak. A bullish crossover would help confirm a recovery.
Moving averages
Price remains below the 50-day and 200-day averages, indicating the broader trend is still under pressure.
Technical indicator readings from October 30, 2026.
Recovery above $0.8895
If SUI closes a 4H candle above $0.8895 with strong volume:
Target 1: $0.9142
Target 2: $0.9323
Target 3: $0.9580
A daily close above $0.9323 would provide stronger reversal confirmation.
Breakdown below $0.8450
If SUI closes below $0.8450:
Target 1: $0.8218
Target 2: $0.8000
Further weakness could expose lower support zones.
Aggressive entry: Look for a bullish reversal candle near $0.8450.
Safer entry: Wait for a confirmed 4H close above $0.8895.
Bullish confirmation: Break above $0.9323.
Risk warning: A breakdown below $0.8450 could trigger another leg down.
#USMidtermElections #KOSPIFalls3.53%BackBelow6000
Daily: Strong selling pressure, with price trading below major moving averages.
4H: Downtrend remains intact; sellers have control.
Short-term: A relief bounce is possible after the recent decline.
Volume: Elevated volatility means breakouts and breakdowns need confirmation.
The latest technical data shows a bearish daily trend, with RSI around 35–38, approaching oversold territory.
RSI (14)
Daily RSI is around 35–38. Selling pressure is strong, but a short-term bounce could develop.
Momentum remains weak. A bullish crossover would help confirm a recovery.
Moving averages
Price remains below the 50-day and 200-day averages, indicating the broader trend is still under pressure.
Technical indicator readings from October 30, 2026.
Recovery above $0.8895
If SUI closes a 4H candle above $0.8895 with strong volume:
Target 1: $0.9142
Target 2: $0.9323
Target 3: $0.9580
A daily close above $0.9323 would provide stronger reversal confirmation.
Breakdown below $0.8450
If SUI closes below $0.8450:
Target 1: $0.8218
Target 2: $0.8000
Further weakness could expose lower support zones.
Aggressive entry: Look for a bullish reversal candle near $0.8450.
Safer entry: Wait for a confirmed 4H close above $0.8895.
Bullish confirmation: Break above $0.9323.
Risk warning: A breakdown below $0.8450 could trigger another leg down.