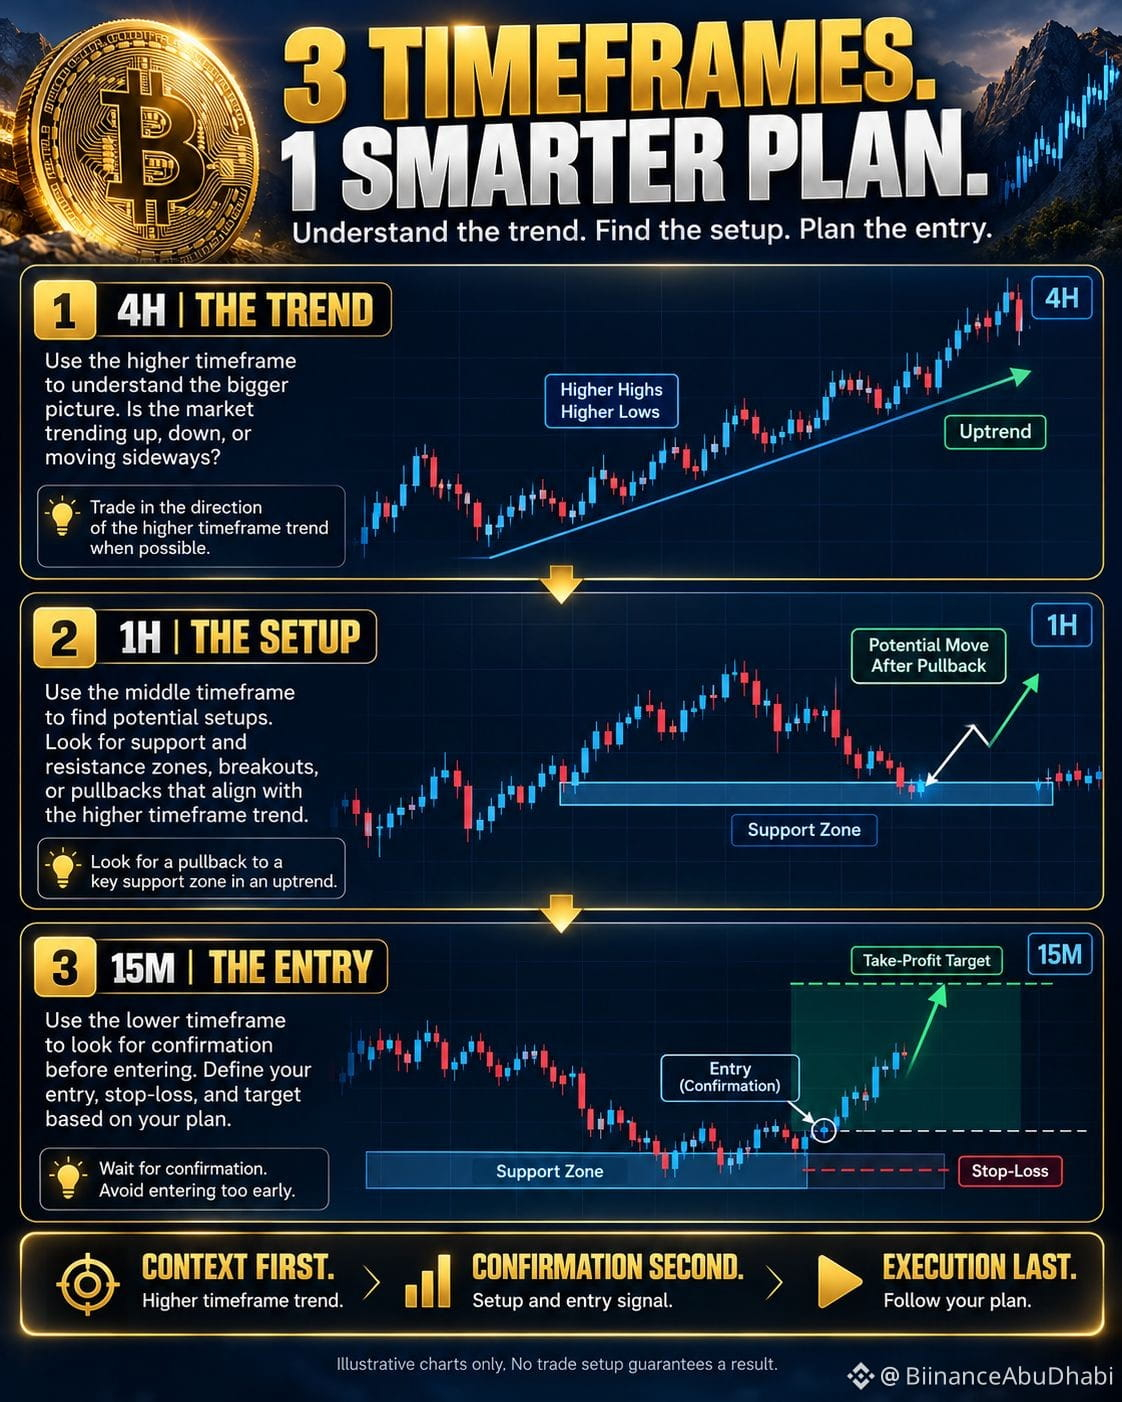
📊 ONE CHART ISN'T ALWAYS ENOUGH. USE 3 TIMEFRAMES!
.
Ever entered a trade that looked perfect on the 5-minute chart, only to see the price move against you? 👀
.
You might be missing the bigger picture.
.
Experienced traders often use Multi-Timeframe Analysis to understand the trend, identify setups, and plan entries.
.
🔹 1. HIGHER TIMEFRAME — FIND THE TREND
📈 Daily or 4H chart
.
Is the market trending up, trending down, or moving sideways? Understand the bigger picture before planning a trade.
.
🔹 2. MIDDLE TIMEFRAME — FIND THE SETUP
📊 1H chart
.
Look for important support and resistance zones, breakouts, or potential pullbacks that align with your trading plan.
.
🔹 3. LOWER TIMEFRAME — PLAN THE ENTRY
🎯 15M or 5M chart
.
Look for confirmation before entering. Define your entry, stop-loss, and invalidation level.
.
⚠️ THE GOLDEN RULE
.
Don't let a small timeframe convince you to ignore the bigger trend.
.
More charts don't automatically mean better trades. Conflicting signals are a reason to pause, not force an entry.
.
💡 REMEMBER: Higher timeframes provide context. Lower timeframes help refine timing. Neither predicts the future or guarantees success.
.
💬 Which timeframe do you use most for crypto trading: 5M, 15M, 1H, or 4H?
.
#BTC $BTC $ZEC $ETH #BinanceSquare
.
Ever entered a trade that looked perfect on the 5-minute chart, only to see the price move against you? 👀
.
You might be missing the bigger picture.
.
Experienced traders often use Multi-Timeframe Analysis to understand the trend, identify setups, and plan entries.
.
🔹 1. HIGHER TIMEFRAME — FIND THE TREND
📈 Daily or 4H chart
.
Is the market trending up, trending down, or moving sideways? Understand the bigger picture before planning a trade.
.
🔹 2. MIDDLE TIMEFRAME — FIND THE SETUP
📊 1H chart
.
Look for important support and resistance zones, breakouts, or potential pullbacks that align with your trading plan.
.
🔹 3. LOWER TIMEFRAME — PLAN THE ENTRY
🎯 15M or 5M chart
.
Look for confirmation before entering. Define your entry, stop-loss, and invalidation level.
.
⚠️ THE GOLDEN RULE
.
Don't let a small timeframe convince you to ignore the bigger trend.
.
More charts don't automatically mean better trades. Conflicting signals are a reason to pause, not force an entry.
.
💡 REMEMBER: Higher timeframes provide context. Lower timeframes help refine timing. Neither predicts the future or guarantees success.
.
💬 Which timeframe do you use most for crypto trading: 5M, 15M, 1H, or 4H?
.
#BTC $BTC $ZEC $ETH #BinanceSquare