


Oil fell a little on Monday after a strong rally, but prices are still high. Reports say Middle East supply risk and inflation worries are holding prices up. Traders are also waiting for the Fed decision on Wednesday, October 28, at 18:00 UTC 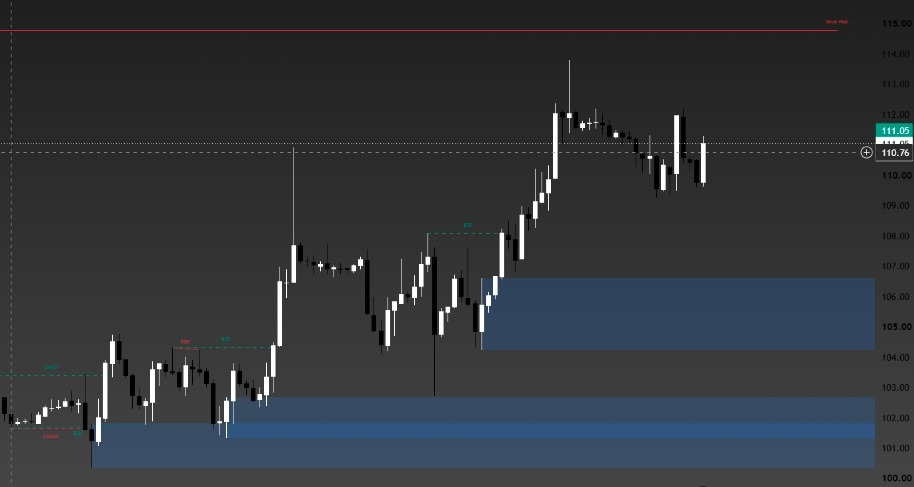
Quick explainer
Brent is the main global oil price.
WTI is the main US oil price.
Prices on a chart can differ by a few dollars from prices in news reports, because charts can use different contracts. Here we use chart levels.
What does the Brent 4-hour chart show?
Brent is around $111.
The recent high is near $113.8. An earlier high sits near $114.8. These are resistance areas, where sellers showed up before.
The recent low is near $109.5. This is the first support to watch.
Further down, a demand zone (an area where buyers showed up before) sits at $104.3 to $106.7. Another sits at $100.4 to $102.7.
What does the WTI 4-hour chart show?
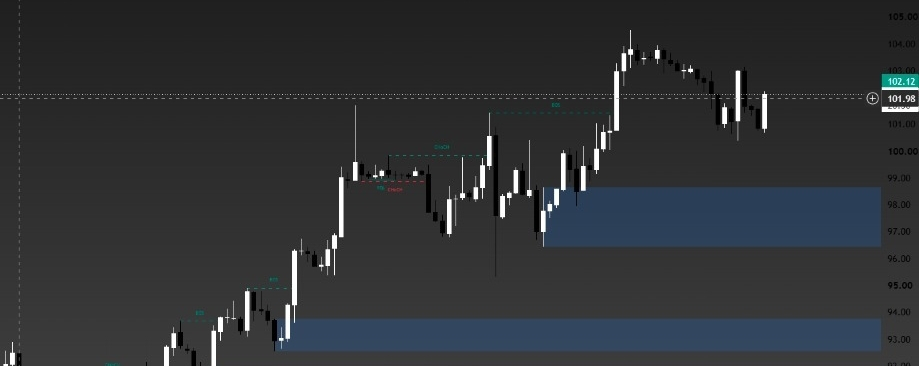
WTI is around $102.
The recent high is near $104.4.
The recent low is near $100.5.
Lower demand zones sit at $96.5 to $98.7, and $92.6 to $93.7.
Levels are zones, not exact lines. Price can move a little above or below them.
Why does oil matter for other markets?
High oil keeps inflation worries alive.
The Fed may keep interest rates high for longer.
Assets like gold and crypto can feel pressure.
That is why many traders watch oil, even if they never trade it.
What could happen next?
If oil stays below its recent highs, it may keep moving sideways or test the recent lows.
If it breaks below the recent lows, the next areas to watch are the demand zones.
If it moves above the recent highs, prices may rise further, especially if Middle East news gets worse.
No one can know in advance which way price will go. One headline can move oil fast, so keep your risk small.
Do you check oil prices before you trade? Tell us in the comments.
#Oil #Brent #WTI #Crude #Energy #Inflation #Fed #Crypto
Not financial advice. Do your own research (DYOR).