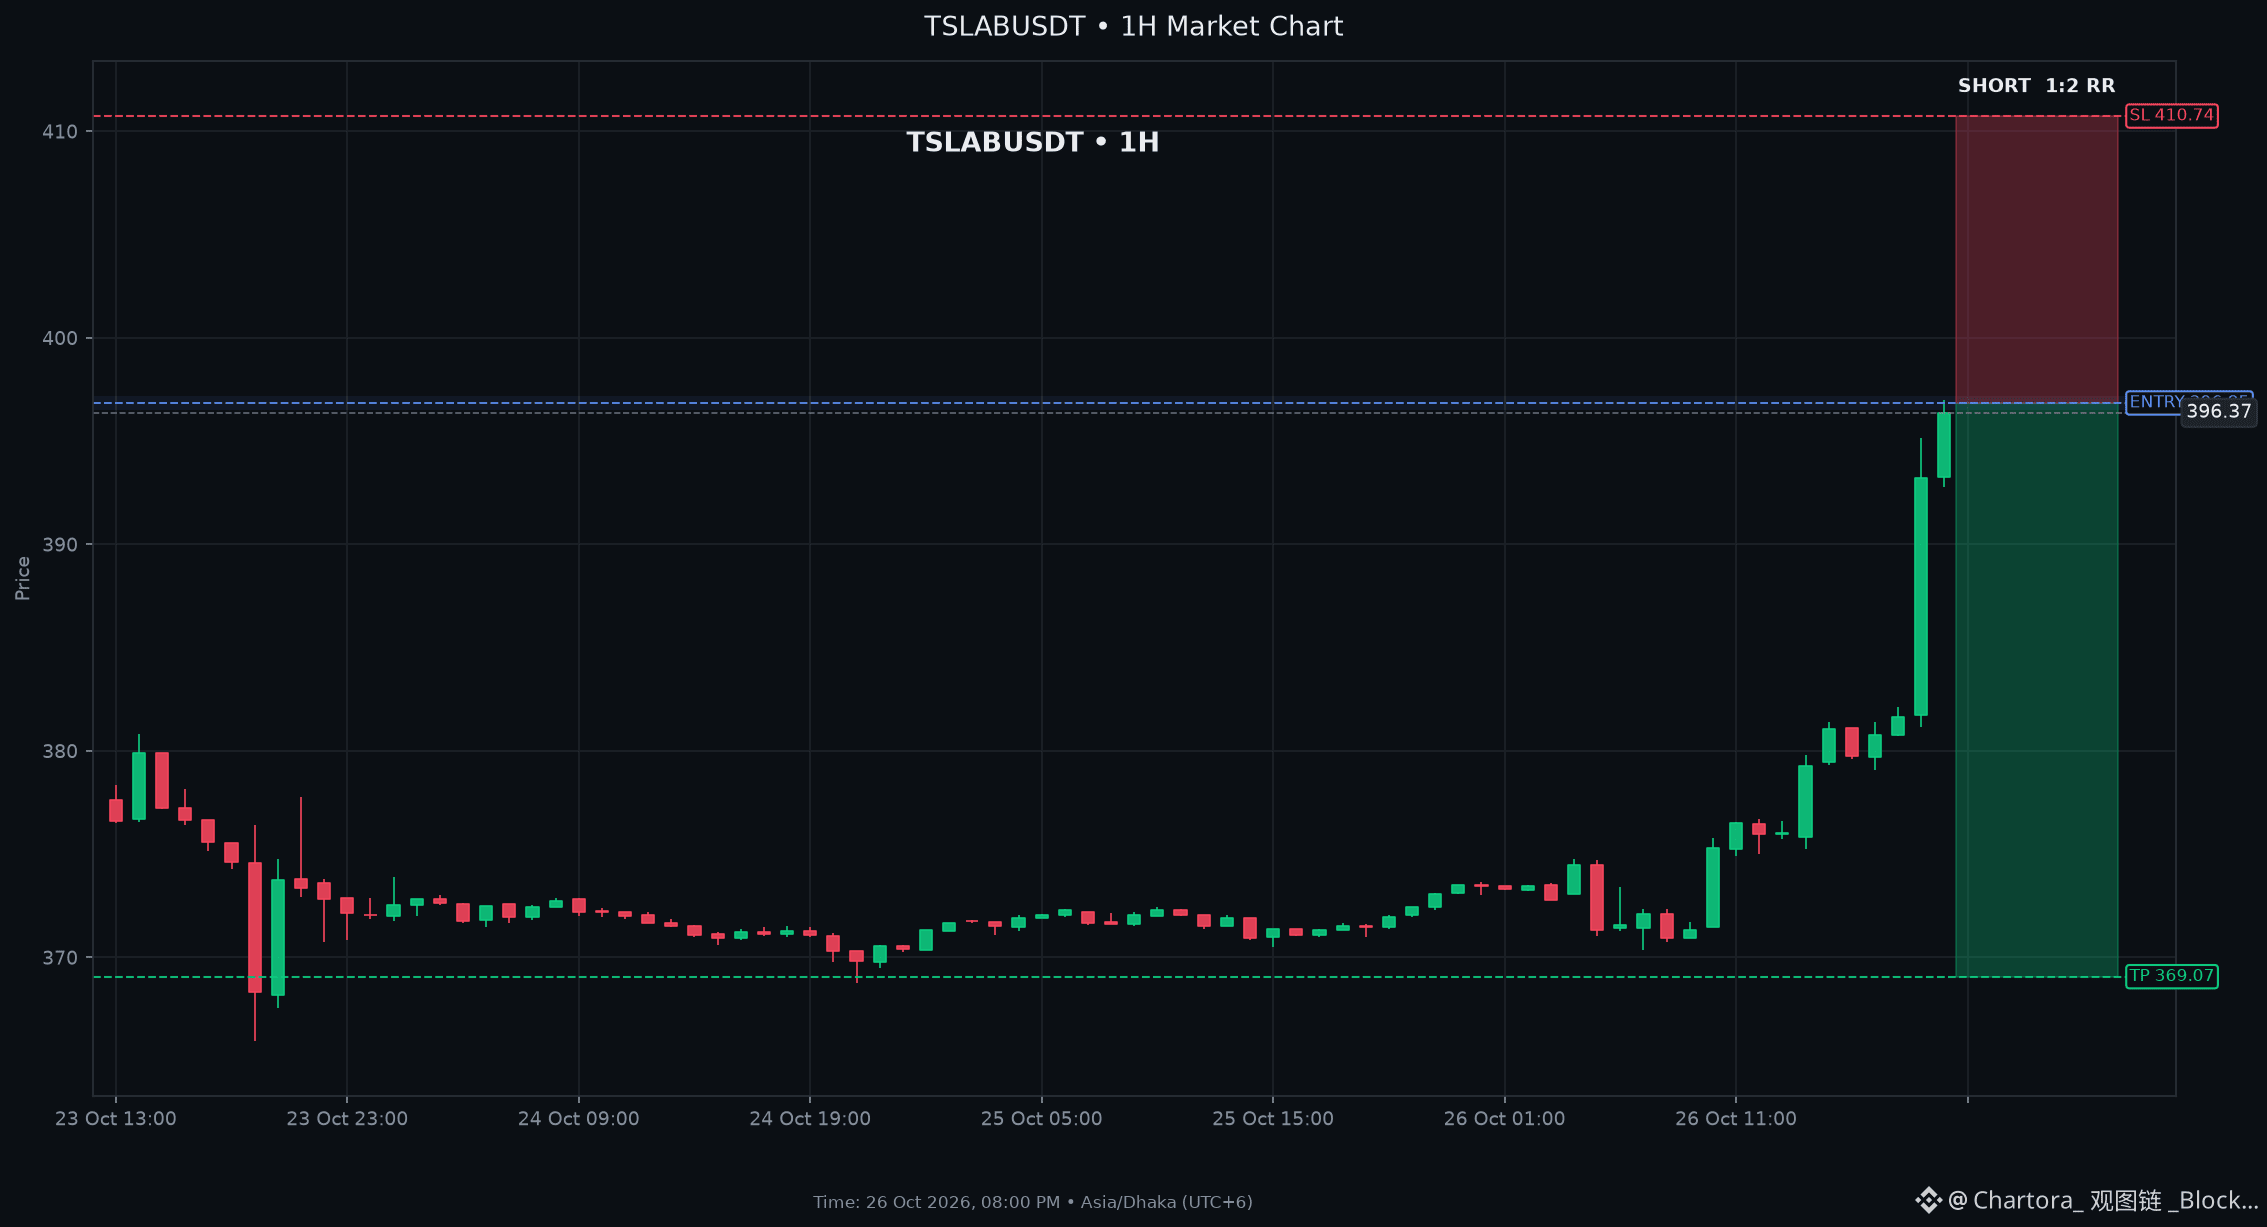
$TSLAB : High Volume Selling Sweep Breaks $TSLAB Market Structure
SHORT SETUP TSLAB
Entry: $396.500 - $397.200
Stop Loss: $410.740
Take Profit: $369.070 (2R)
Key Levels: Support $379.060 | Resistance $397.300
Technical Analysis for $TSLAB : RSI at 86.9 and Stochastic K at 97.6 indicate extreme overbought conditions. Price sits above the upper Bollinger band and just below the 1hour resistance 397.3, suggesting a pullback. Together, these indicators favor SHORT continuation toward support. Negative momentum and trend readings give this setup a clear bearish structure. The nearby resistance and support levels frame the current market structure.
Market Context: BTC is down 0.6% on the 4hour chart, showing a bearish trend, while overall market breadth is mixed with 57.7% green assets.
SHORT $TSLAB