

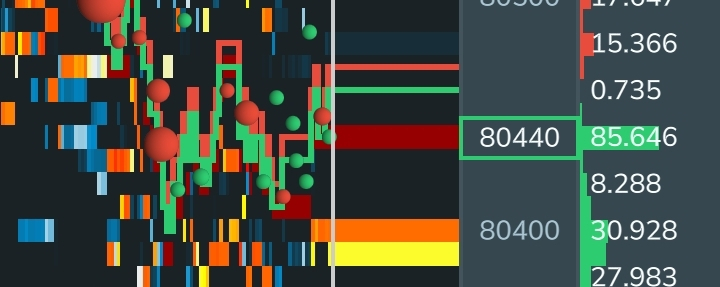

Bitcoin’s short-term price action is showing strong selling pressure, with recent movements highlighting a battle between buyers and sellers. The current order-flow chart provides useful clues about potential support and resistance zones.
📊 Key Market Observations
🔴 1. Selling Pressure
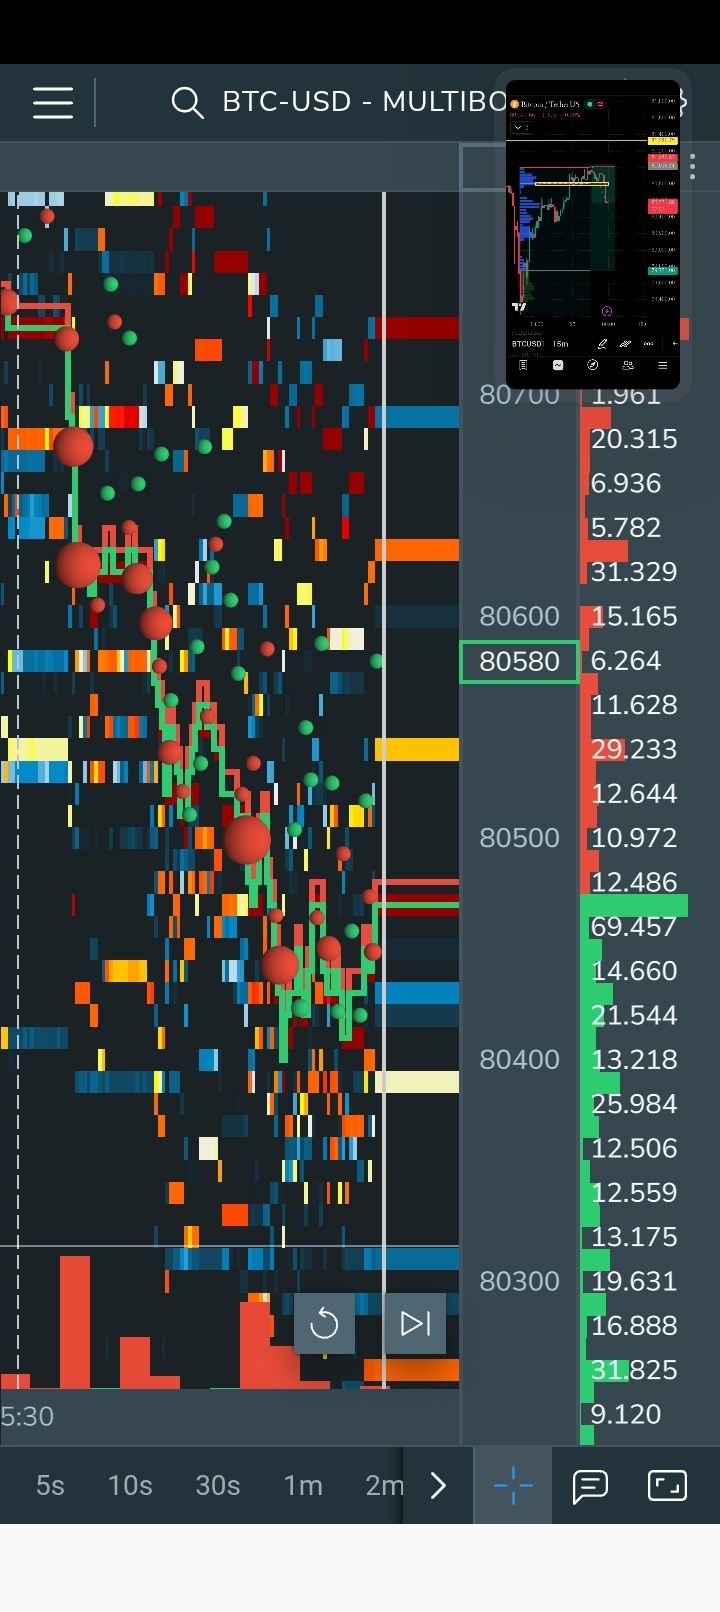
The chart shows a short-term downward move from higher price levels toward the 80,400 area. This suggests that sellers have recently maintained control, although a reversal is not confirmed.
🟢 2. Potential Support Zone
The 80,400–80,450 region is worth watching for signs of buying interest. If buyers defend this area and price forms a strong bullish reaction, BTC could attempt a short-term recovery.
🟡 3. Resistance to Watch
The 80,500–80,600 zone may act as an important resistance area. A strong move above this region, supported by buying volume, could improve the short-term bullish outlook.
📈 Bullish Scenario
If BTC holds support and breaks above nearby resistance with strong buying pressure, a recovery toward higher levels may develop.
📉 Bearish Scenario
If the price breaks below 80,400 and fails to reclaim the level, selling pressure could continue. Traders should watch for confirmation rather than entering based on a single candle.
🎯 My Trading View
For now, BTC requires confirmation before choosing a direction. I would monitor price reactions around support and resistance, along with volume and order-flow changes, before considering a trade.
⚠️ Risk Management: Always use a well-defined stop-loss, manage position size carefully, and avoid emotional trading. This analysis is based on the provided chart screenshot, not live market data.
💬 **What do you think? Will BTC bounce from support or continue moving downward? Share your analysis in the comments!
#Bitcoin #BTC #CryptoAnalysis #BinanceSquare #tradingStrategy