


🚀
BNB ($BNB) — Utility, Momentum & Key Technical Levels$BNB
BNB remains one of the major crypto assets to watch because of its role in the BNB Chain ecosystem. Traders should focus on price structure, trading volume, and confirmation before taking a position.
📊 1. Market Overview
Recent market data places BNB around the $730–$750 range, with prices varying across data providers and exchanges. The latest available data shows an intraday recovery following recent volatility. "Source: Binance" (https://www.binance.com/en/price/bnb) · "Historical data" (https://www.investing.com/crypto/bnb/historical-data)
Key market factors to monitor:
- BNB Chain ecosystem activity and network usage.
- Overall Bitcoin trend and crypto market sentiment.
- Trading volume and momentum around important price levels.
- Broader market liquidity and investor risk appetite.
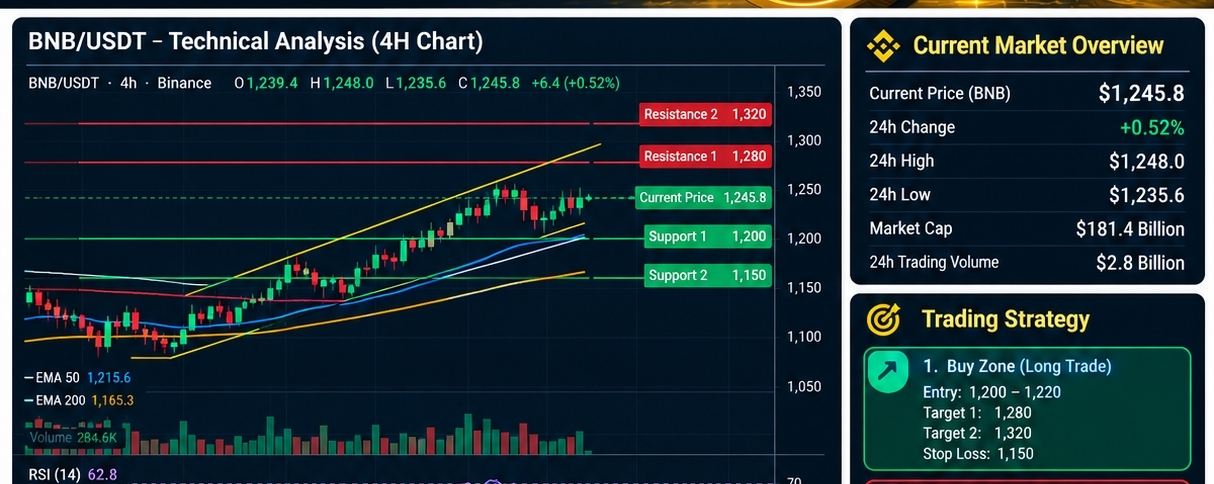
📈 2. Technical Analysis
Resistance zones
- $750: Immediate resistance and a recent intraday high area.
- $770–$780: Potential next resistance zone if bullish momentum strengthens.
Support zones
- $725–$730: Near-term support and recent trading range.
- $705–$710: Lower support area based on recent market lows.
These are reference zones based on recent price data, not guaranteed turning points. Recheck the live BNB/USDT chart before trading.
🎯 3. Advanced Trading Strategy
Strategy A — Breakout Long
Wait for a 4-hour candle to close above $750. Look for rising volume and a successful retest of the breakout level before considering a long entry.
- Entry: After confirmed breakout and retest.
- Stop-loss: Below the retest low.
- Target zones: $770, then $780 if momentum continues.
Strategy B — Support Bounce
If BNB revisits $725–$730, watch for a bullish reversal candle and improving volume.
- Entry: Only after confirmation.
- Stop-loss: Below the confirmed swing low.
- Target: $740–$750 resistance zone.
Strategy C — Breakdown Short
If price closes below $725 with strong selling volume, a short setup may develop.
- Entry: After a failed retest of $725.
- Stop-loss: Above the retest high.
- Target zones: $710, then $705.
Avoid entering solely because price touches a level. Confirmation matters.
📉 4. Indicators to Watch
- EMA 50 and EMA 200: Assess the broader trend and dynamic support or resistance.
- RSI (14): Check momentum; readings above 70 can indicate overbought conditions, while readings below 30 can indicate oversold conditions.
- MACD: Look for momentum shifts and potential crossovers.
- Volume: A breakout supported by higher volume is generally more convincing than one with weak participation.
🧠 5. Bullish vs. Bearish Scenarios
🟢 Bullish: A confirmed breakout above $750 could open the way toward $770–$780.
🟡 Neutral: Continued trading between $725 and $750 may favor patience and range-based analysis.
🔴 Bearish: A confirmed breakdown below $725 could expose the $710–$705 area.
🛡️ 6. Professional Risk Management
- Risk only 0.5%–1% of your trading capital on a single setup.
- Aim for a potential reward at least twice the amount at risk.
- Avoid excessive leverage and emotional entries.
- Never move a stop-loss farther away simply to avoid realizing a loss.
- Wait for confirmation rather than chasing a sudden price spike.
🔥 Final Verdict
BNB presents potential trading opportunities, but the next move depends on whether buyers can reclaim resistance or sellers can break support. The strongest approach is to combine market structure, volume confirmation, and strict risk management.
Trade the setup, not the emotion. Protect capital first.
What is your outlook for BNB?
🟢 Bullish breakout
🟡 Sideways consolidation
🔴 Bearish breakout $BNB
