



XMR climbed to $613.03, gaining 3.17% in 24 hours after recovering from an intraday low near $588.
Support is the key level for XMR at $429.99—and lower levels of the chart are at $382.50 and $282.47, respectively.
A sustained move above $613 could extend gains, while a break below $429.99 would weaken the bullish chart structure.
Since the wider bull market cycle is bullish, XMR needs to have support during a pullback to keep the price rising toward $613, as indicated by the price analysis of Monero.
XMR Rises From Its June Low
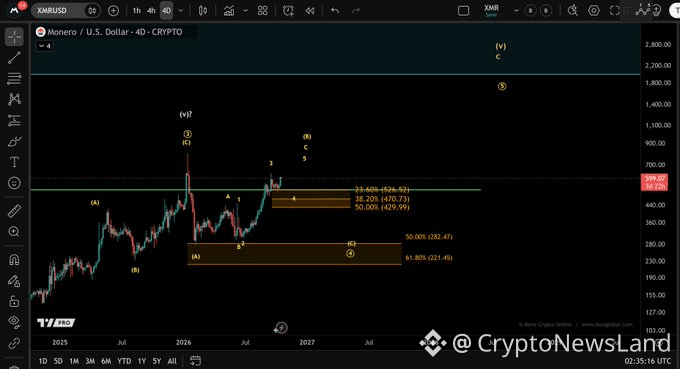
More Crypto Online (@Morecryptoonl) says XMR’s advance from the June low can continue while $429.99 holds. The four hour chart shows a bull market heading towards $600 from about $280. The Elliott Wave labels indicate that the upward move could have more to the upside.
 Source: X
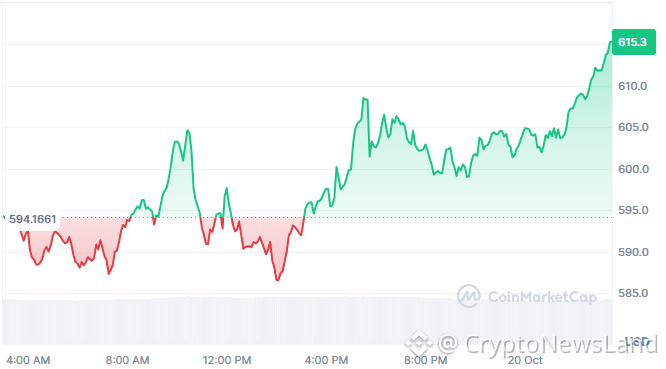
The latest market snapshot puts XMR at $613.03, up 3.17% over 24 hours. During the displayed session, price fell toward $588 before recovering above $600. It then moved higher, reaching the $613 area near the chart’s right edge.
The June recovery has produced a series of higher lows and higher highs. That pattern supports the current upward trend, though it does not rule out a correction. More Crypto Online places the main condition at $429.99, well below the latest price.
Monero’s market capitalization stands at $11.53 billion in the supplied data. It is currently performing a 0.09% decline in the 24-hour trading volume, which is about $174.6 million. The price has increased, even though sales were slightly lower, but this does not necessarily indicate the strength of future demand.
Key Support Levels on the Four-Hour Chart
The chart marks Fibonacci levels at $470.73, $429.99, and $382.50. If XMR pulls back from its recent rally, these prices provide reference points for traders. The $429.99 level matters most because the analyst names it as support for the local uptrend.
A pullback toward $470.73 would bring price back into the marked retracement area. Buyers would need to defend that zone to keep the recovery on track. The chart does not show that a retest is inevitable.
If XMR falls to $429.99, the market would face a more important test. Holding above this level would preserve the analyst’s bullish interpretation. A decisive break below it would weaken the case for a continued advance from June.
Below $429.99, the next marked Fibonacci area sits near $382.50. The chart also shows a deeper level around $282.47, close to the June low region. A decline toward that price would give back much of the recent rally.
What Could Follow the Recent Rally?
XMR is approaching the 610–613 area after its latest rise. If $613 is broken with a nice, long move, a move higher from there could be in order, but the chart does not give a clear near-term target. A break of this area would see $605 and $600 soon to be near watch points.
The intraday chart shows price moving around 600–608 before its latest push. A fall below $600 would put the recent advance under pressure. The earlier low around 588–590 marks a deeper area where buyers previously returned.
 Source: Coinmarketcap
The longer term Elliott Wave forecast suggests $1,800 and further. To get up there, the upwards trend would have to cross some resistance. The projection is not a short-term forecast or confirmation that the move will occur.
The market panel lists both total and circulating supply at 18.82 million XMR. It shows no fixed maximum supply and reports a fully diluted valuation of $11.53 billion. These figures describe Monero’s current market profile but do not predict its next price move.
XMR’s upward trend remains intact under the analyst’s framework while $429.99 holds. A move above the recent high would support the case for further gains. A break below the stated support would require a fresh assessment of the Elliott Wave count.