


🚀 Solana (SOL) Price Analysis — October 19, 2026 | Key Levels to Watch
📊 SOL Market Outlook: Recovery Attempt or Another Drop?
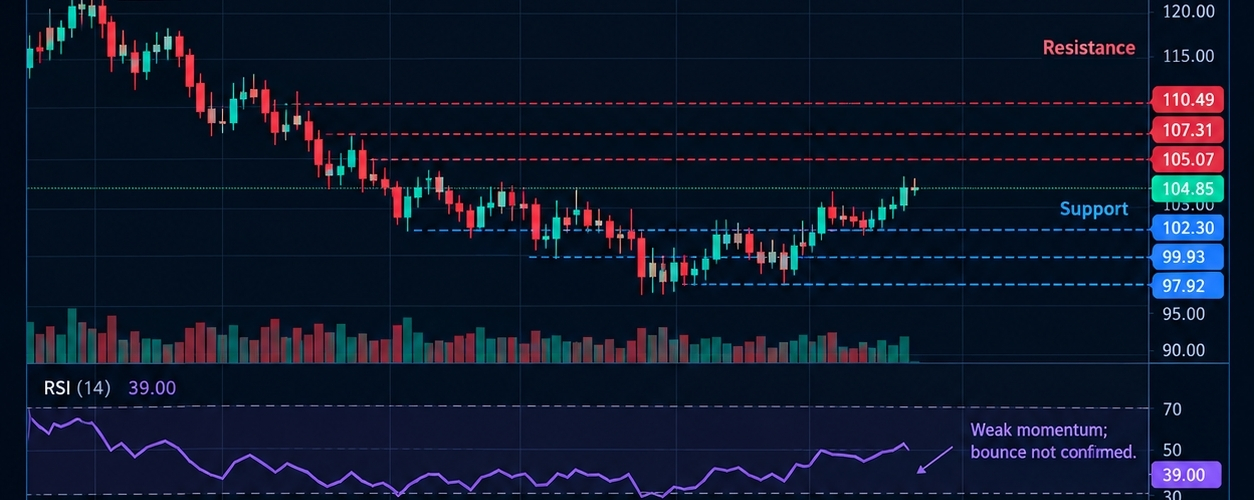
Solana (SOL) is attempting to recover after recent selling pressure. The price is trading around the $104–$105 zone, where bulls need to overcome nearby resistance to strengthen the recovery.
Technical indicators show weak momentum, so traders should wait for confirmation rather than chase a sudden price move.
🔍 Key Technical Levels
🔴 Resistance Zones
- $105.07 — First resistance
- $107.31 — Second resistance
- $110.49 — Major short-term resistance
🟢 Support Zones
- $102.30 — Immediate support
- $99.93 — Important psychological support zone
- $97.92 — Lower support
📈 Bullish Scenario
If SOL breaks above $105.07 and confirms the breakout with a strong daily candle and increasing volume, the next levels to watch are $107.31 and $110.49.
A sustained move above resistance could improve short-term market sentiment.
📉 Bearish Scenario
If SOL loses the $102.30 support on a confirmed daily close, selling pressure could push the price toward $99.93 and potentially $97.92.
A temporary bounce is not enough to confirm a trend reversal.
🧠 Advanced Trading Strategy
✅ Monitor the 4-hour and daily charts.
✅ Use RSI and MACD to assess momentum.
✅ Confirm breakouts with trading volume.
✅ Wait for a retest before considering an entry.
✅ Always define stop-loss and position size before trading.
My Market View: Neutral to cautiously bullish for a short-term recovery, but confirmation above resistance is essential. SOL remains vulnerable if support breaks.
⚠️ Risk Disclaimer: This is technical analysis for educational purposes, not financial advice. Cryptocurrency markets are volatile. Always do your own research and manage risk carefully.