


🚨 **LITECOIN ($LTC) ANALYSIS: THE MOST IMPORTANT TRENDLINE TEST IS HERE! 📉📈**
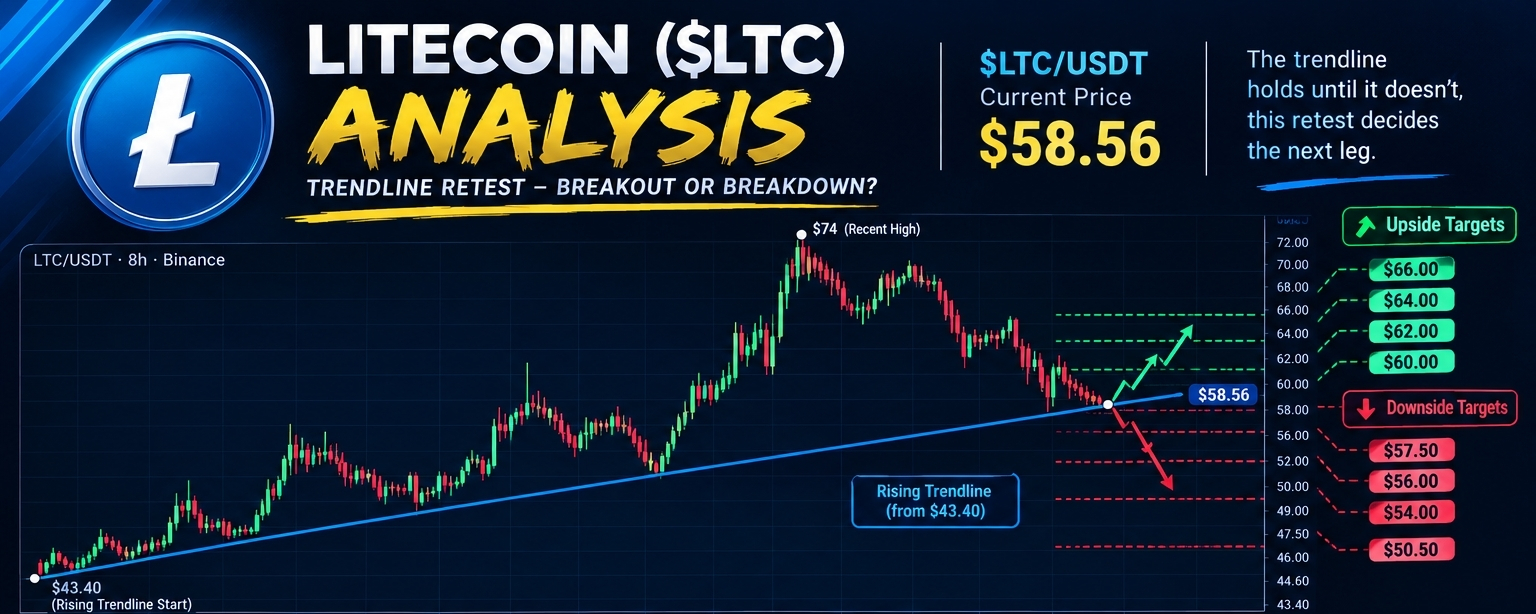
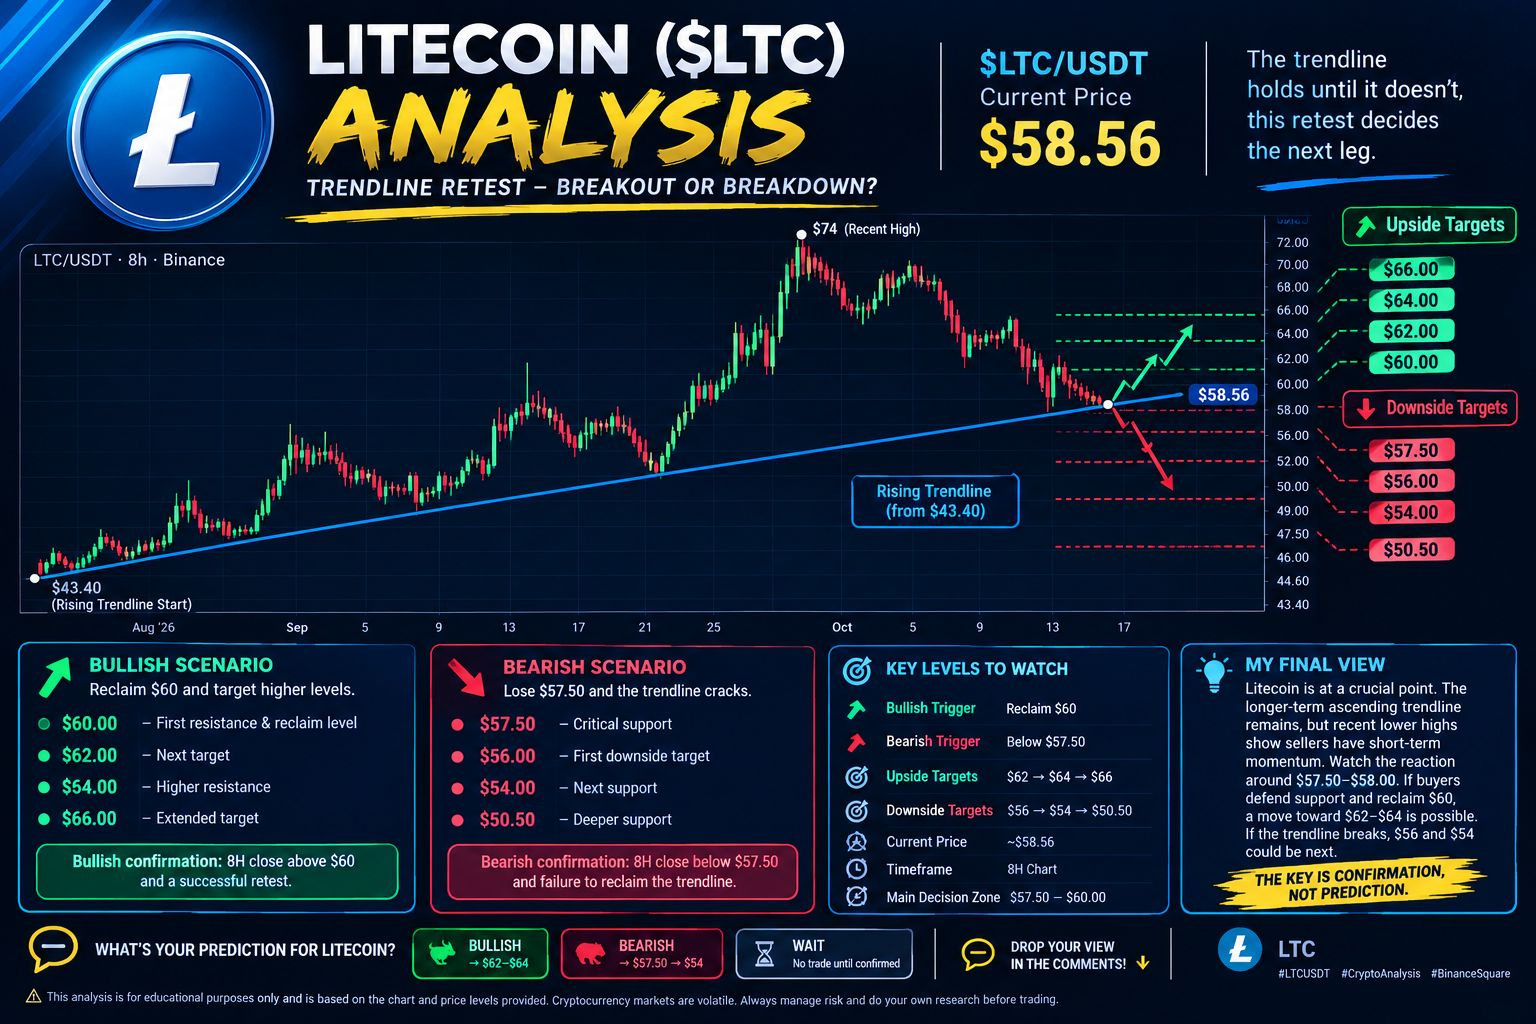
$LTC/USDT is trading around **$58.56**, and the 8-hour chart is showing a critical battle between buyers and sellers. After a strong rally from $43.40 toward $74, Litecoin has entered a correction phase, and price is now testing a major rising trendline that has supported the uptrend since August.
**Will buyers defend the trendline, or are we about to see another breakdown?** 👀
🔍 **1. MARKET STRUCTURE: WHAT DOES THE CHART TELL US?**
Looking at the 8H chart, Litecoin experienced a powerful rally from approximately $43.40, climbing above $50, $60, and eventually reaching the $73–$74 region.
However, sellers took control near the highs. Since then, price has formed lower highs and moved downward toward the rising trendline.
This tells us three important things:
• The broader rally created a significant ascending support structure.
• Short-term momentum has weakened as sellers continue to pressure price.
• The current trendline retest could determine whether buyers can preserve the bullish structure.
⚠️ Remember: An ascending trendline can provide support, but it is not a guarantee that price will bounce.
🔵 **2. THE RISING TRENDLINE: THE KEY BATTLE ZONE**
The blue trendline connects important swing lows beginning near $43.40. It has previously supported price during pullbacks, including the September correction.
On October 15, buyers defended the area with a sharp wick toward $57.20. Now, LTC is approaching the same region again, trading around $58.56.
Repeated tests of support can produce a bounce, but they can also weaken the level if buyers fail to respond strongly.
The next 8-hour candles are especially important. Watch for a strong rejection wick, a bullish recovery, and a reclaim of nearby resistance before assuming the trendline will hold.
🟢 **3. BULLISH SCENARIO — CAN LTC RECOVER $60?**
If buyers successfully defend the $57.50–$58.00 region and reclaim $60, the short-term outlook could improve.
🎯 **Key upside levels:**
• **$60.00:** First resistance and bullish reclaim level.
• **$62.00:** Next resistance and potential upside target.
• **$64.00:** A stronger recovery target if buying momentum continues.
• **$66.00:** An extended target if LTC breaks through $64 with sustained strength.
A move above $60 alone does not confirm a full trend reversal. Buyers would need to demonstrate continued strength through the $62 and $64 resistance zones.
📈 **Bullish confirmation:** A convincing 8H close above $60, followed by a successful retest, would strengthen the recovery scenario.
🔴 **4. BEARISH SCENARIO — WHAT IF $57.50 BREAKS?**
The downside risk increases if Litecoin loses the rising trendline and fails to recover it.
📉 **Key downside levels:**
• **$57.50:** Critical support threshold.
• **$56.00:** First potential downside target.
• **$54.00:** Next important support zone.
• **$50.50:** A deeper support area if selling pressure accelerates.
A brief wick below $57.50 is not necessarily a confirmed breakdown. Traders should watch for an 8-hour candle closing below support and whether price fails to reclaim the broken trendline.
If that happens, the bullish structure could weaken considerably, with $56 and $54 becoming important areas to monitor.
⚖️ **5. THE MOST IMPORTANT LEVELS TO WATCH**
🟢 Bullish trigger: Reclaim $60
🎯 Upside targets: $62 → $64 → $66
🔴 Bearish trigger: Confirmed breakdown below $57.50
🎯 Downside targets: $56 → $54 → $50.50
📌 Current price: Approximately $58.56
📌 Timeframe: 8-hour chart
📌 Main decision zone: $57.50–$60.00
These are technical reference levels based on the supplied chart, not guaranteed price destinations.
🧠 **6. MY FINAL MARKET VIEW**
Litecoin is sitting at a crucial point. The longer-term ascending trendline remains visible, but the recent sequence of lower highs shows that sellers currently have short-term momentum.
I would watch the reaction around $57.50–$58.00 before taking a directional view.
If buyers defend support and reclaim $60, a recovery toward $62–$64 becomes a reasonable scenario. However, if the trendline breaks decisively, the market could move toward $56 and $54.
**The key is confirmation, not prediction.** Let the 8H candle structure show which side is gaining control instead of entering based on the trendline alone.
💬 **YOUR TURN: What is your prediction for Litecoin?**
🚀 BULLISH — LTC bounces toward $62–$64
🐻 BEARISH — LTC breaks $57.50 and drops toward $54
⏳ WAIT — No trade until the breakout or breakdown is confirmed
Drop your view in the comments! 👇
⚠️ **Risk Disclaimer:** This analysis is for educational purposes only and is based on the chart and price levels provided. Cryptocurrency markets are volatile. Always manage risk and do your own research before trading.
#LTC #Litecoin #CryptoAnalysis #TechnicalAnalysis #BinanceSquare $LTC