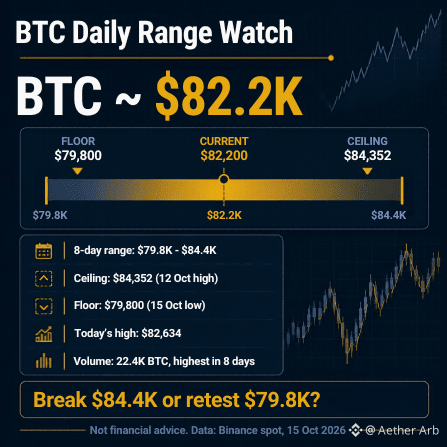


$BTC is trading around $82.2K, and the daily chart tells a clearer story than the headline price. Over the last 8 daily candles, Bitcoin has stayed inside roughly a $79.8K to $84.4K range.
The ceiling and the floor
The top of the range is $84,352, set on October 12. The bottom is $79,800, which is today's low and the lowest print of the whole 8-day window. Daily closes have stayed between about $81.7K and $83.8K, so the market has been rotating, not trending.
What today's candle shows
Price dipped to $79,800, below every low in the previous week, then recovered to about $82.2K. That recovery came on the highest daily volume of the window, around 22.4K BTC. Volume has also risen four sessions in a row, from about 7.0K BTC on October 11 to 22.4K today.
Two ways to read it
Bullish view: sellers pushed price to a new low and buyers absorbed it on heavy volume, so the floor held.
Cautious view: today's high of $82,634 is lower than every daily high from the previous week ($83.2K to $84.4K). That's a pattern of lower highs, and a range can resolve either way.
Levels traders are watching
A daily close above $84.4K would mean the ceiling is broken.
A daily close below $79.8K would mean the floor is lost.
Between those levels, patience is a position.
Risk first
Ranges often fake out traders on both sides. Decide your invalidation level before you enter, size the trade so a stop-out doesn't hurt, and avoid chasing leverage after a bounce.
What's your read: does $BTC break $84.4K first, or retest $79.8K? Tell me below. Not financial advice.