


Moonbeam (GLMR) is trading near $0.010154, up approximately 7% in 24 hours, based on the supplied Binance data.
📊 1H Chart: Recovery Faces Resistance
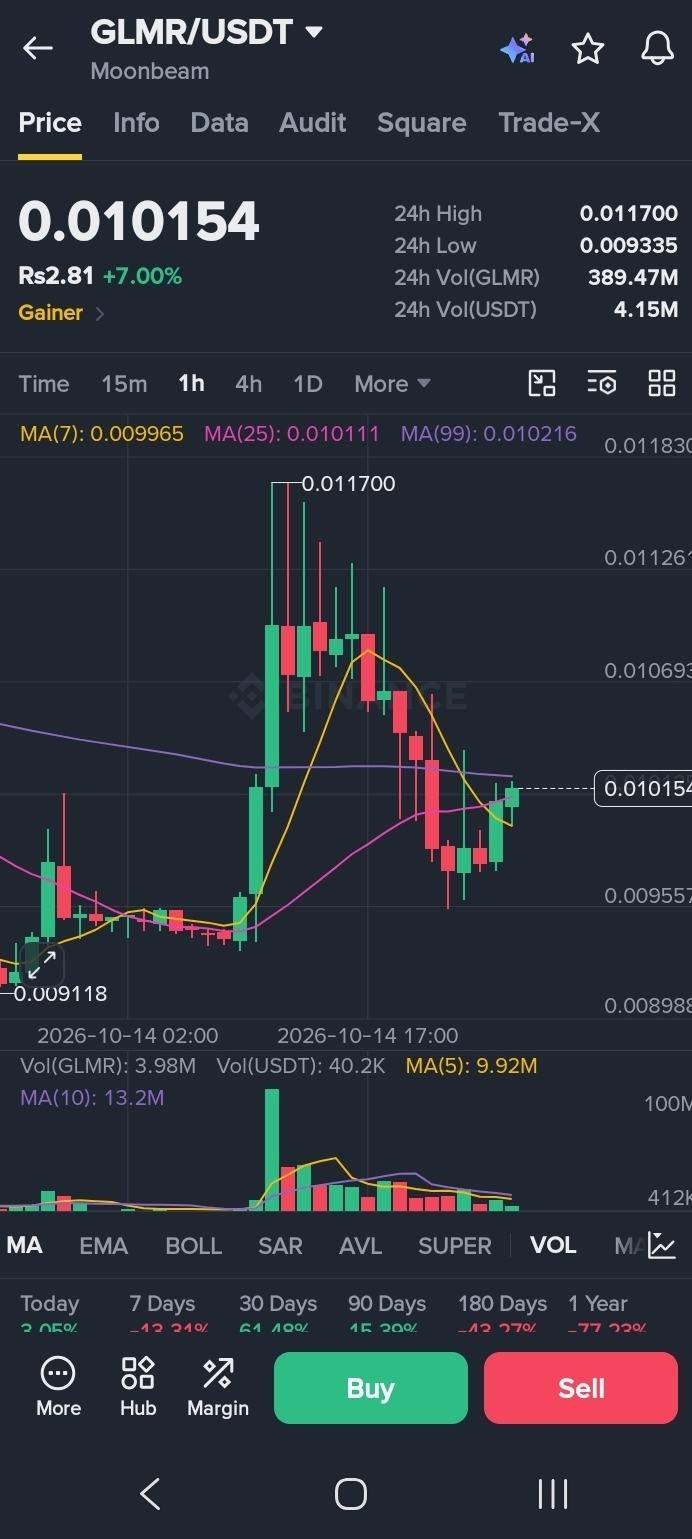
On the 1-hour chart, GLMR is above MA(7) at $0.009965 and MA(25) at $0.010111, but remains below MA(99) at $0.010216.
This suggests a short-term recovery attempt, although buyers still need to overcome nearby resistance to strengthen the bullish case.
📈 1D Chart: Broader Recovery Structure
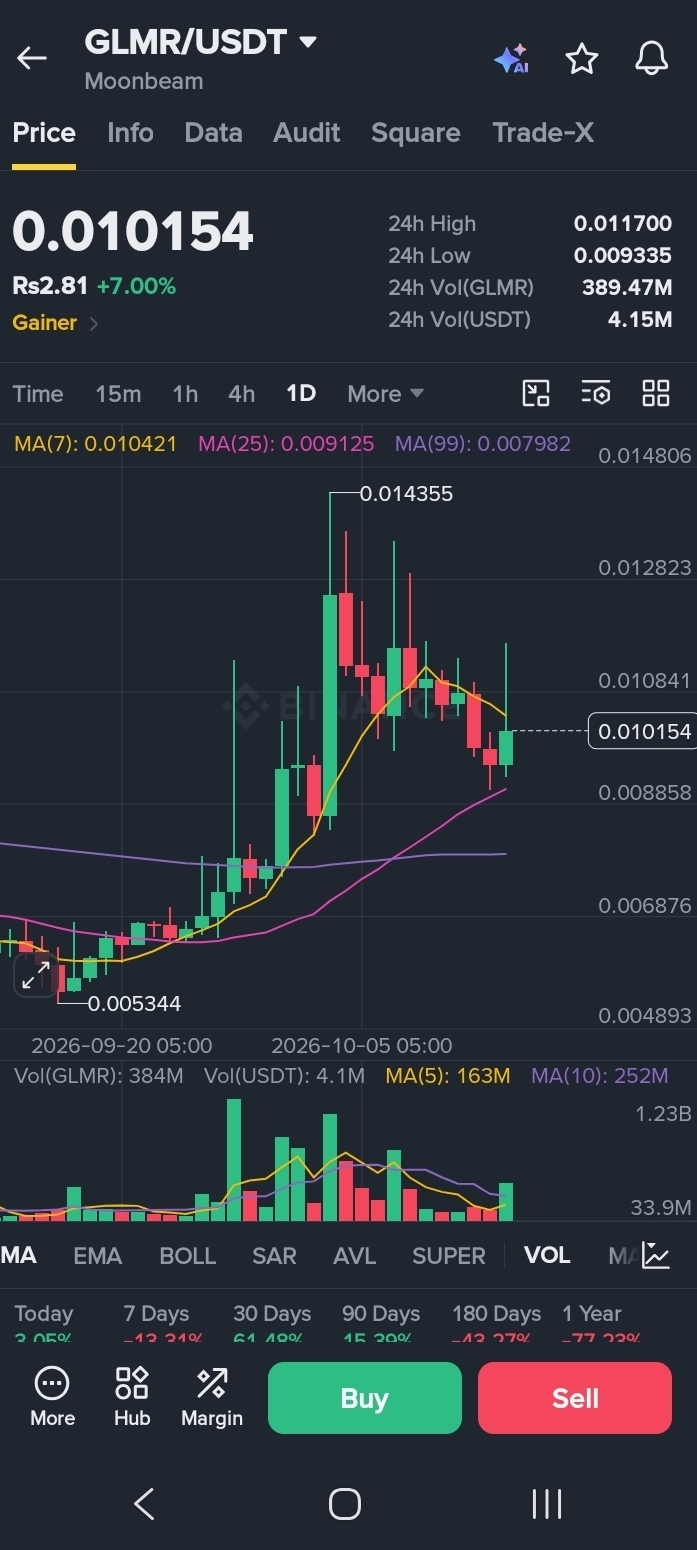
On the daily chart, GLMR is below MA(7) at $0.010421 but remains above MA(25) at $0.009125 and MA(99) at $0.007982.
The daily structure suggests that the broader recovery remains intact, but the price needs to regain its short-term daily average to show renewed strength.
🎯 Levels to Watch
Resistance: $0.010216, then $0.011700
Near-term support: $0.009965
Additional support: $0.009125
A sustained move above $0.010216 could improve momentum toward the 24-hour high. A break below $0.009965 could expose GLMR to further weakness.
🔍 Final Outlook
GLMR's 1H chart shows a recovery attempt, while the 1D chart points to a mixed but still constructive broader structure. Confirmation is needed before calling this a breakout.
Can GLMR reclaim $0.0117, or will sellers push the price lower?
This is market analysis for informational purposes only, not financial advice. Cryptocurrency trading involves risk.
#GLMR #Moonbeam #CryptoAnalysis #BinanceSquare #Altcoins #CryptoMarket