


Axelar (AXL) is attracting attention after gaining approximately 10.6% in 24 hours, with AXL/USDT trading near $0.0605 in the supplied Binance market data.
📊 1H Chart: Momentum Needs Confirmation
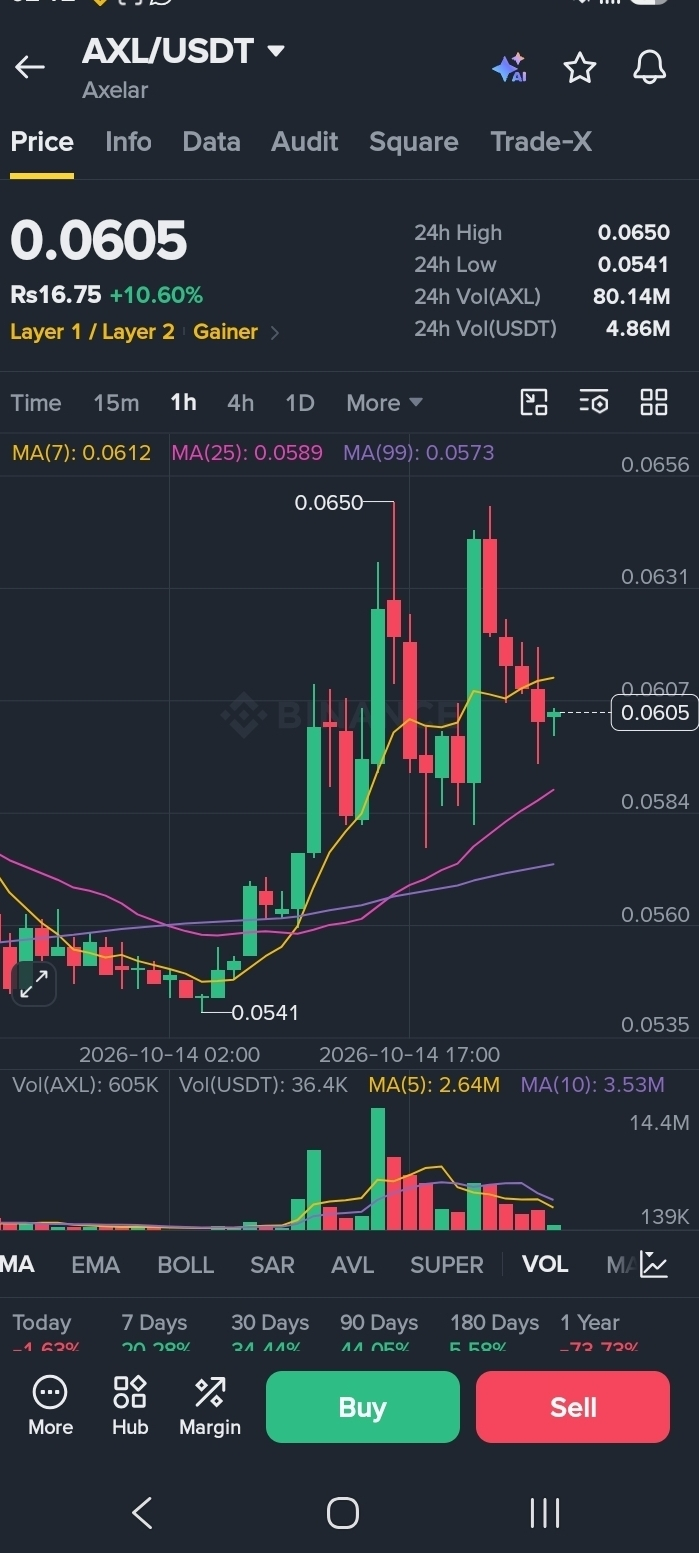
On the 1-hour chart, AXL is trading below MA(7) at $0.0612 but remains above MA(25) at $0.0589 and MA(99) at $0.0573.
This suggests that short-term momentum has cooled after the recent rise, while the broader hourly structure remains constructive. Reclaiming MA(7) could strengthen the recovery attempt, whereas losing the $0.0589 area may indicate additional weakness.
📈 1D Chart: Broader Structure Is Bullish
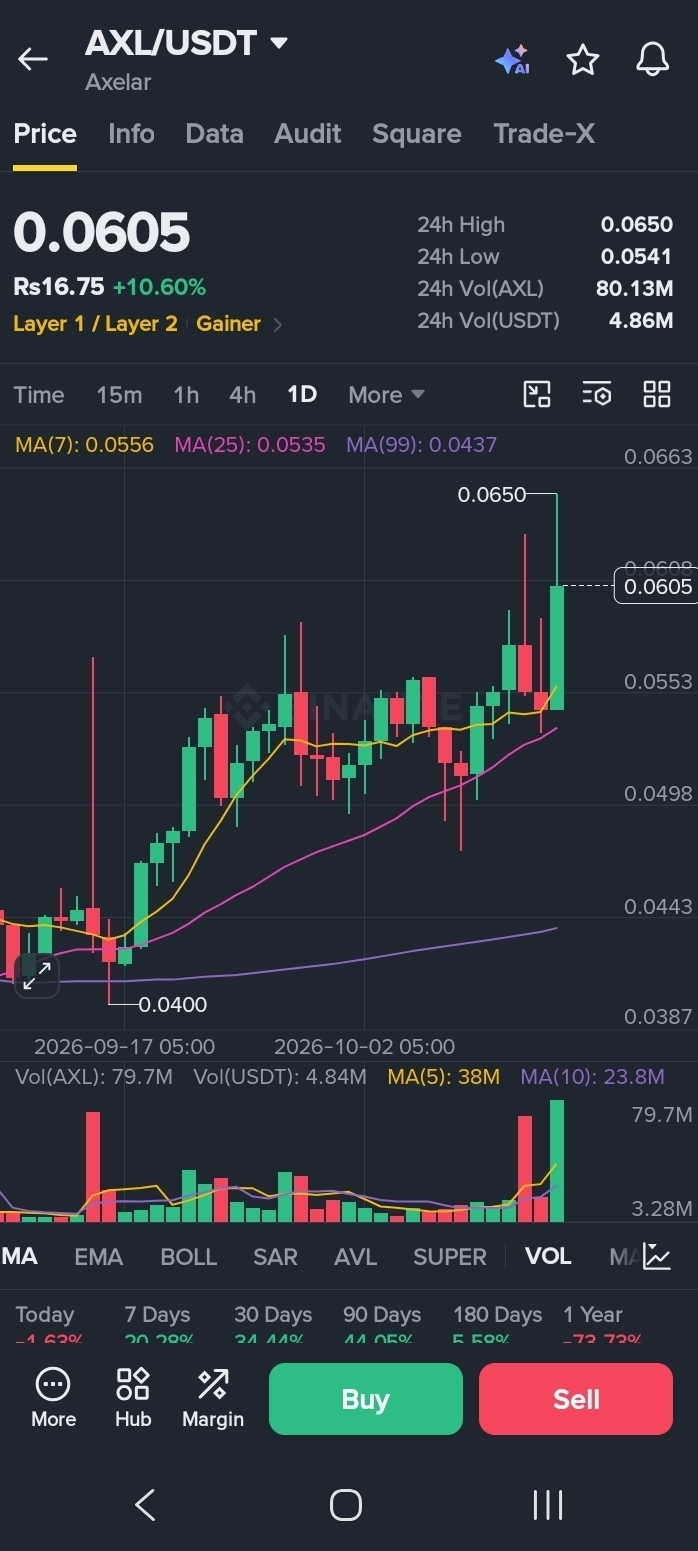
On the daily chart, AXL is trading above MA(7) at $0.0556, MA(25) at $0.0535, and MA(99) at $0.0437.
This moving-average alignment supports a positive broader trend, although it does not guarantee that the rally will continue.
🎯 Key Levels to Watch
Resistance: $0.0650
Near-term level: $0.0612
Support: $0.0589
Additional support: $0.0573
A sustained move above $0.0612 could improve the chance of retesting $0.0650. A break below $0.0589 would raise the risk of a deeper pullback.
🔍 Final Outlook
AXL's daily chart remains constructive, but its hourly chart suggests that buyers still need to regain short-term momentum. The next move depends on whether price can reclaim nearby resistance or loses support.
Will AXL challenge $0.0650, or will sellers take control?
This analysis is for informational purposes only and is not financial advice. Cryptocurrency markets are volatile, and trading involves risk.
#AXL #Axelar #CryptoAnalysis #BinanceSquare #Altcoins #CryptoMarket