

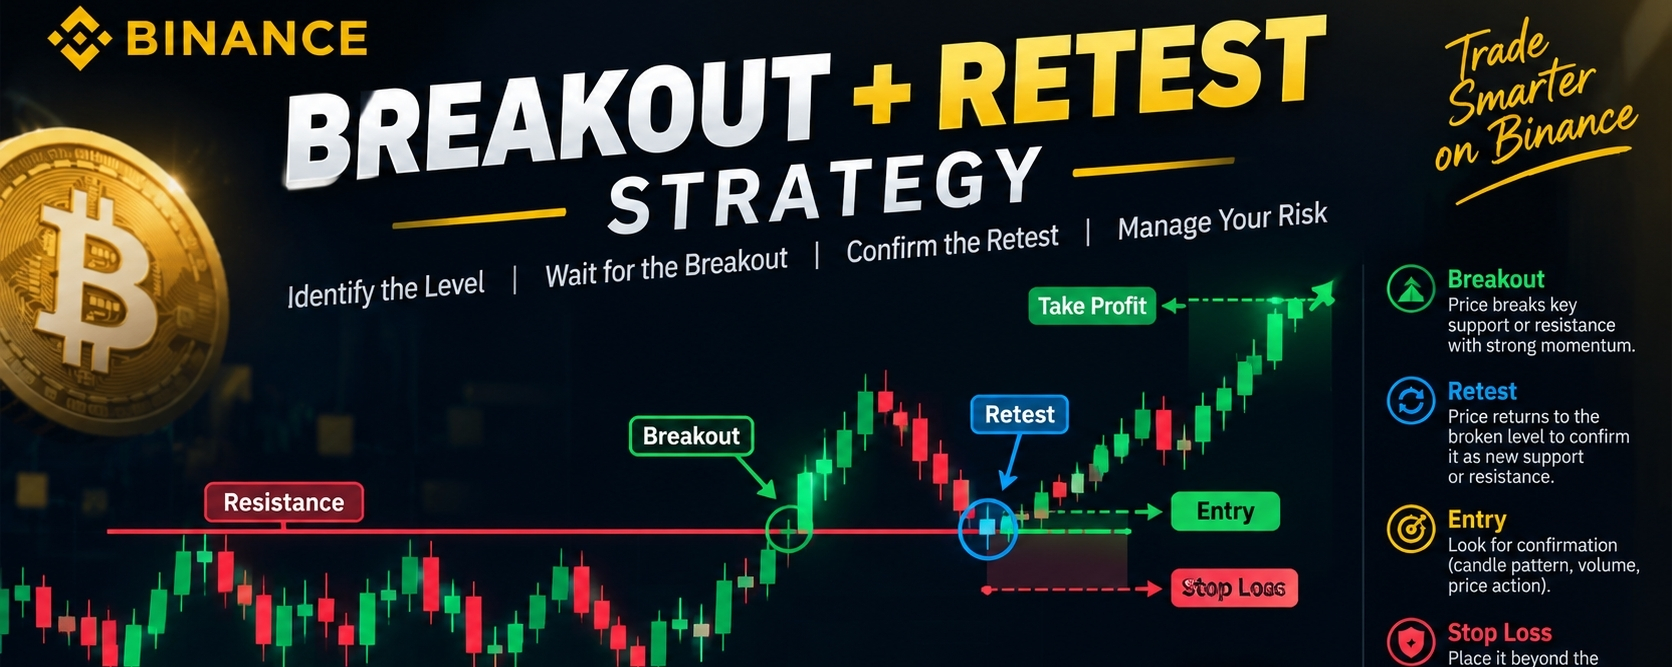

📈 Breakout + Retest Strategy: Trade Smarter on Binance!
Many traders lose money because they enter a trade too early, chase green candles, or sell during sudden price drops. One strategy that can help traders identify potential opportunities is the Breakout + Retest Strategy.
Let's understand how it works! 🚀
🔹 1. What Is a Breakout?
A breakout happens when the price moves above a resistance level or below a support level with sufficient momentum.
🟢 Bullish Breakout: Price breaks above resistance, potentially signaling further upward movement.
🔴 Bearish Breakout: Price breaks below support, potentially signaling further downward movement.
Example:
Imagine BTC is trading between $60,000 and $62,000.
- Resistance: $62,000
- Support: $60,000
If BTC breaks above $62,000, it may indicate bullish momentum.
However, be careful! Not every breakout is genuine. Some are false breakouts designed to trap traders.
🔹 2. What Is a Retest?
A retest occurs when the price returns to a previously broken support or resistance level to test whether that level can hold.
For example:
1. BTC breaks above resistance at $62,000.
2. The price moves up to $63,000.
3. BTC returns toward $62,000.
4. Buyers step in, and the price starts moving upward again.
In this example, the previous resistance may now act as support.
This is called a Resistance-to-Support Flip.
The same principle works in reverse during a bearish breakdown: previous support may become resistance.
🔹 3. How to Trade the Breakout + Retest Strategy
Follow these five steps:
STEP 1: Identify Support and Resistance
Mark important price levels on your chart. Look for areas where price has repeatedly reversed or struggled to move through.
STEP 2: Wait for the Breakout
Wait for a candle to close beyond the key level. A candle closing beyond the level is generally more convincing than a brief wick through it, although it does not guarantee success.
STEP 3: Wait for the Retest
Avoid chasing the breakout candle. Allow the price to return toward the broken level.
STEP 4: Look for Confirmation
Look for signs that the level is holding, such as:
- A bullish engulfing candle after a bullish breakout.
- A bearish rejection candle after a bearish breakdown.
- A strong rejection wick.
- Increased trading volume supporting the move.
STEP 5: Plan Your Entry and Risk
Consider entering after confirmation rather than assuming the retest will succeed.
For a bullish setup, a stop-loss may be placed below the retest's swing low. For a bearish setup, it may be placed above the retest's swing high.
Choose the stop-loss based on market structure and volatility, not an arbitrary distance.
🔹 4. Real Trading Example: BTC/USDT
Imagine BTC is trading near $60,000.
Trading Element| Example
Resistance| $60,000
Breakout Price| $60,200
Retest Area| $60,000–$60,100
Entry After Confirmation| $60,150
Stop-Loss| $59,800
Take-Profit Target| $60,850
How does this trade work?
BTC breaks above $60,000 and later returns to the breakout area. Buyers defend the level, and a bullish candle provides confirmation.
A trader enters at $60,150, with a stop-loss at $59,800 and a target at $60,850.
- Potential risk: $350 per BTC.
- Potential reward: $700 per BTC.
- Risk-to-reward ratio: 1:2.
These figures are hypothetical and exclude trading fees and slippage. The example illustrates the strategy, not a prediction that BTC will reach these prices.
🔹 5. How to Avoid False Breakouts
False breakouts are among the biggest challenges in this strategy.
Use these precautions:
✅ Wait for a candle close beyond the key level.
✅ Check whether trading volume supports the breakout.
✅ Wait for a retest instead of entering impulsively.
✅ Look for confirmation from price action.
✅ Avoid trading directly into a strong opposing support or resistance zone.
✅ Consider the overall market trend and volatility.
Remember: volume, candle closes, and retests can improve your analysis, but none can guarantee a successful trade.
🔹 6. Which Timeframe Is Best?
Your timeframe depends on your trading style.
- 5-minute chart: More opportunities, but more market noise.
- 15-minute chart: Useful for short-term setups.
- 1-hour chart: Often provides clearer intraday structure.
- 4-hour chart: Useful for identifying larger price levels.
A practical approach is to identify major support and resistance on the 1-hour or 4-hour chart, then look for entry confirmation on the 15-minute chart.
🔹 7. The Biggest Mistakes to Avoid
❌ Buying immediately after a huge green candle.
❌ Entering before the breakout candle closes.
❌ Assuming every retest will hold.
❌ Placing a stop-loss without considering market structure.
❌ Using excessive leverage.
❌ Risking too much capital on a single trade.
Risk management matters more than finding a perfect entry.
Even a well-planned setup can fail. Consider limiting the amount you risk on each trade and calculate your position size before entering.
🔥 Final Thoughts
The Breakout + Retest Strategy is a straightforward way to approach crypto trading with a structured plan.
Instead of chasing price, wait for a key level to break, observe the retest, and look for confirmation before entering.
Identify the level. Wait for the breakout. Confirm the retest. Manage your risk.
Remember: No trading strategy wins every time. Practice on historical charts or use a demo account before risking real money.
💬 Question for the community:
Which trading setup do you prefer?
1️⃣ Breakout Trading
2️⃣ Breakout + Retest
3️⃣ Support and Resistance
Share your thoughts in the comments! 👇
#BinanceSquare #CryptoTrading #Bitcoin #TechnicalAnalysis #TradingStrategy #PriceAction #RiskManagement