


Stacks (STX) is showing renewed strength, with STX/USDT trading around $0.4130, up approximately 4.50% over 24 hours, according to the supplied Binance screenshots.
The token has climbed above its daily moving averages, while the hourly chart shows a potential short-term pause after the rally.
With the recent 24-hour high at $0.4614, traders are watching whether STX can regain bullish momentum—or whether resistance will trigger another pullback.
📈 1. Daily Chart: Bulls Have the Advantage
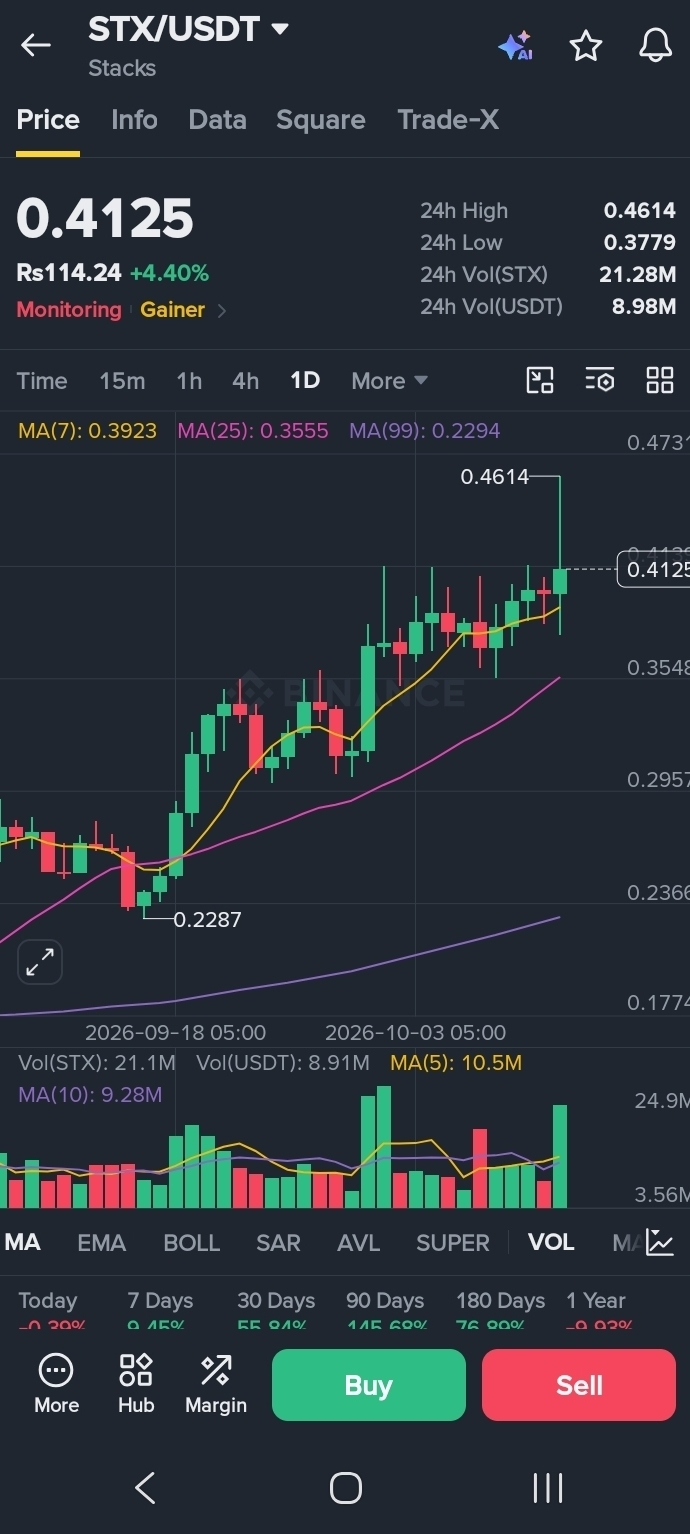
The daily moving averages show a constructive structure:
MA(7): $0.3923
MA(25): $0.3555
MA(99): $0.2294
STX is trading above all three averages. This suggests that the broader trend has strengthened significantly compared with its earlier price levels.
Daily trading volume is approximately 21.1 million STX, above the displayed MA(5) of 10.5 million and MA(10) of 9.28 million.
The combination of a stronger daily structure and elevated trading activity makes STX worth watching. However, elevated volume does not guarantee that buying pressure will continue.
⏱️ 2. Hourly Chart: A Short-Term Test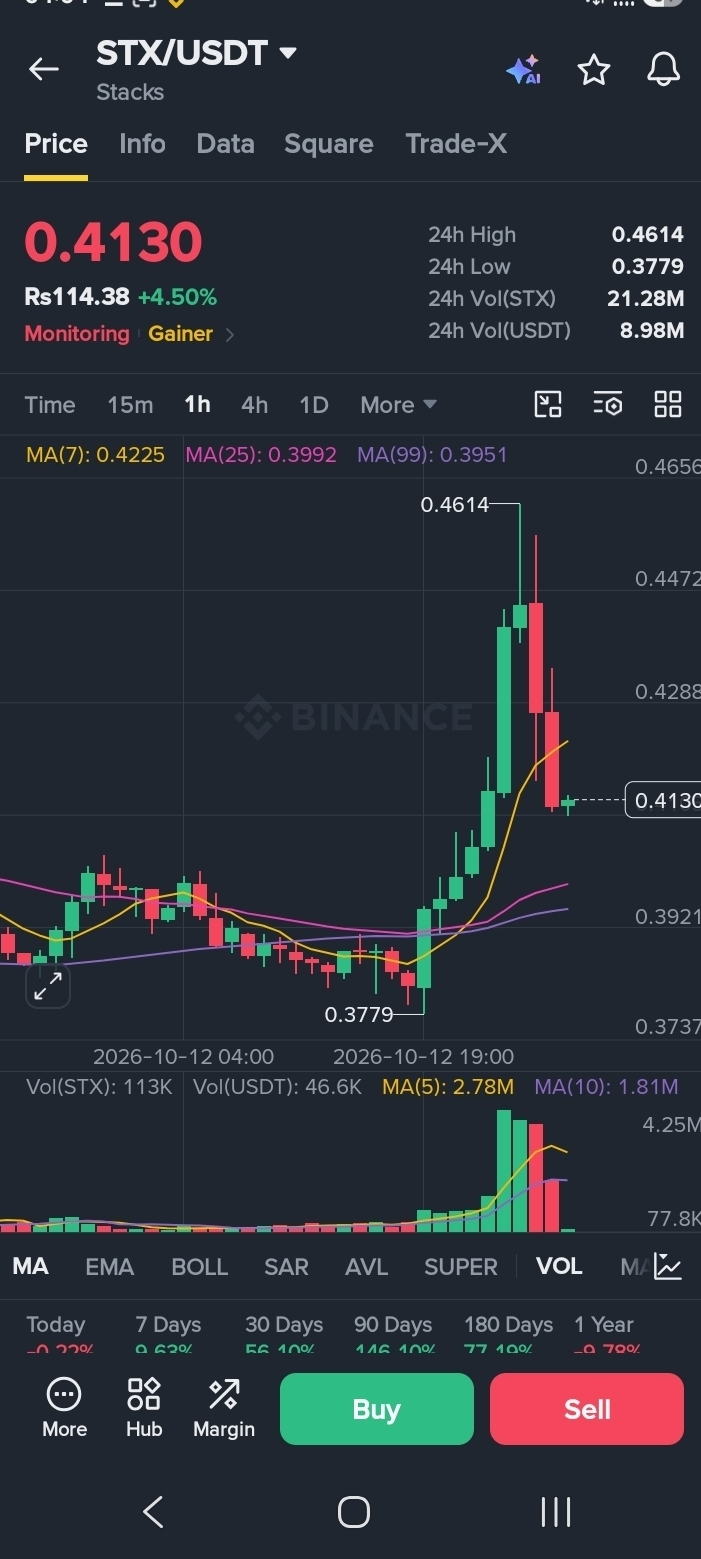
The 1-hour chart presents a more mixed picture:
MA(7): $0.4225
MA(25): $0.3992
MA(99): $0.3951
At $0.4130, STX is below MA(7), but remains above MA(25) and MA(99).
This suggests that short-term momentum has cooled, although the price is still holding above important hourly moving averages.
The next challenge is to reclaim the $0.4225 area. A convincing move above it, supported by stronger volume, would improve the short-term bullish outlook.
🎯 3. Key Support and Resistance Levels
Based on the levels visible in the supplied charts:
Resistance zones
$0.4225–$0.4288: First hurdle for a recovery.
$0.4472: Next resistance area.
$0.4614–$0.4656: Major recent-high resistance zone.
Support zones
$0.3992–$0.3951: Hourly moving-average support area.
$0.3921: Additional nearby chart support.
$0.3779–$0.3737: Lower support zone if selling pressure increases.
These are technical reference areas, not guaranteed turning points.
🚀 4. Bullish Scenario: Can STX Reclaim $0.4225?
If STX moves above $0.4225 and holds the level on a retest, the next areas to watch are $0.4288 and $0.4472.
A stronger move toward $0.4614–$0.4656 would require sustained buying interest and convincing volume.
A brief move above resistance is not enough by itself. Candle closes, volume and the ability to hold the breakout level are important confirmation signals.
⚠️ 5. Bearish Scenario: What If the Rally Fades?
If STX fails to reclaim $0.4225, the price could revisit the $0.3992–$0.3951 support area.
A break below this zone could expose $0.3921, followed by the $0.3779–$0.3737 area.
The daily trend may remain constructive even during a short-term correction, but traders should avoid assuming that every dip will recover.
🧠 Final Verdict: STX Is Worth Watching
Stacks has a stronger daily chart, supported by price action above its three displayed moving averages and elevated daily volume.
However, the hourly chart shows that STX still needs to reclaim $0.4225 to improve its immediate momentum.
My view: Watch the $0.4225 breakout level and the $0.3992–$0.3951 support zone. Confirmation matters more than chasing a fast price move.
What do you think—can STX challenge $0.4614 again, or will resistance trigger another pullback? Share your view below. 👇
Disclaimer: This article is for educational purposes only and is not financial advice. Price levels and indicators are based on the supplied Binance screenshots and may change quickly. STX carries market risk, and its Monitoring designation should be reviewed before trading. Always conduct your own research and manage risk carefully.
#STX #Stacks #STXUSDT #CryptoAnalysis #TechnicalAnalysis #BinanceSquare #BitcoinEcosystem #Altcoins #CryptoMarket