
🚀 $NEAR Protocol (NEAR) Analysis: Is $6.00 the Next Target or a Bull Trap?
🔥 $NEAR is showing powerful bullish momentum, but the next move will be crucial!
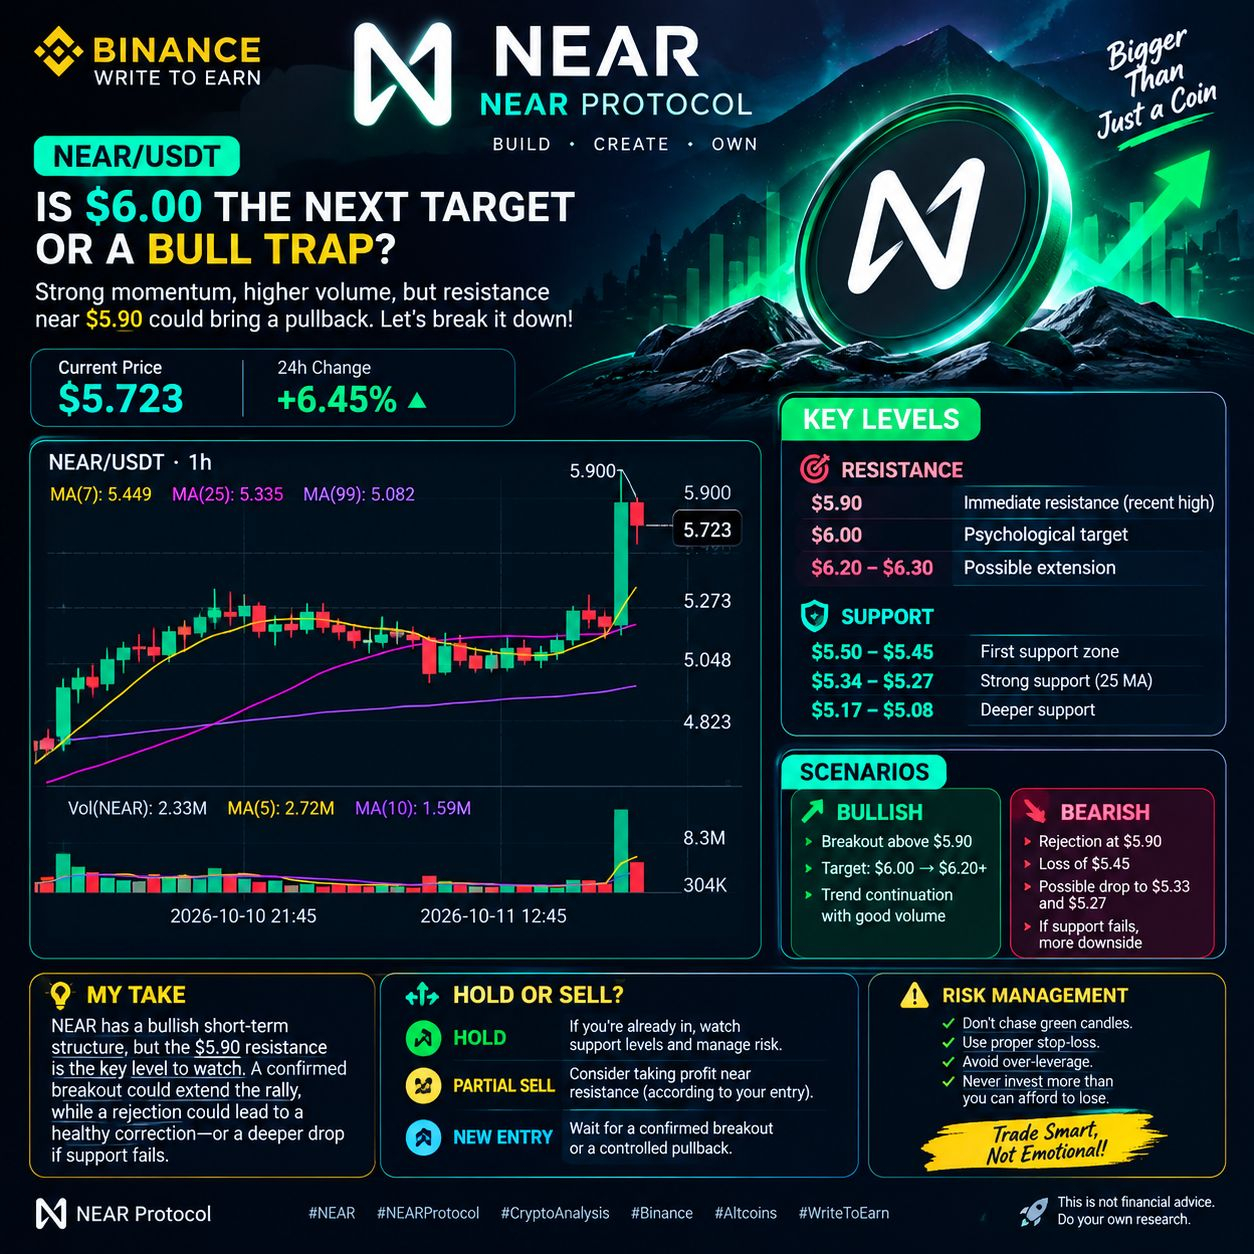
NEAR/USDT is trading around $5.723, up approximately 6.45% in 24 hours, according to the chart. A strong green candle accompanied by a significant volume spike suggests aggressive buying pressure. However, the rejection near $5.90 raises an important question: Can bulls sustain this rally, or will sellers take control?
📊 1. Technical Analysis: Bulls Have the Momentum
The 1-hour chart shows NEAR trading above its key moving averages:
🟡 MA(7): $5.449
🟣 MA(25): $5.335
🟪 MA(99): $5.082
The short-term moving averages are positioned below the current price, supporting the bullish structure. The sharp breakout and increased volume indicate strong market participation, although one candle alone cannot confirm a sustained trend reversal.
🎯 2. Key Resistance Levels
- $5.90: Immediate resistance and recent high.
- $6.00: Psychological target if buyers break above $5.90.
- $6.20–$6.30: Possible extension if the breakout holds and momentum continues.
A strong close above $5.90, followed by a successful retest, would strengthen the bullish scenario. Rejection at this level could trigger profit-taking.
🛡️ 3. Important Support Zones
- $5.50–$5.45: First area to watch for a pullback.
- $5.34–$5.27: Potential support zone around the 25-period MA and previous price action.
- $5.17–$5.08: Deeper support zone if selling pressure increases.
These are technical observation zones, not guaranteed price floors.
⚠️ 4. What Could Go Wrong?
After a rapid upward move, early buyers may start taking profits. The latest red candle after the $5.90 high shows that selling pressure is present.
If NEAR fails to hold the $5.45 area, a deeper retracement becomes possible. A breakdown below $5.27 could weaken the short-term bullish structure further.
Chasing a large green candle without a plan can be dangerous, especially in a volatile crypto market.
💎 5. Hold or Sell? My Technical Perspective
📈 Bullish scenario: A confirmed breakout above $5.90 could open the way toward $6.00 and potentially $6.20–$6.30.
📉 Bearish scenario: A rejection at $5.90 followed by a loss of $5.45 could bring $5.33 and $5.27 into focus.
🤝 Holding: Existing holders may monitor whether support remains intact rather than making emotional decisions.
💰 Taking profit: Traders can consider partial profit-taking near resistance according to their own entry price and risk tolerance.
🧠 New entry: Waiting for a confirmed breakout or a controlled pullback may offer a clearer setup than blindly buying after a huge candle.
🔥 Final Verdict: NEAR currently has a bullish short-term structure, but the $5.90 resistance is the key level to watch. A confirmed breakout could extend the rally, while a rejection could lead to a healthy correction—or a deeper decline if support fails.
Remember: The market rewards discipline, not blind confidence. Manage risk, avoid excessive leverage, and never invest more than you can afford to lose.
What do you think? Will NEAR break $5.90 and reach $6.00, or will sellers push it back toward $5.30? Share your analysis below! 👇
Disclaimer: This is technical analysis for educational purposes, not financial advice. Price targets are conditional scenarios, not guarantees.