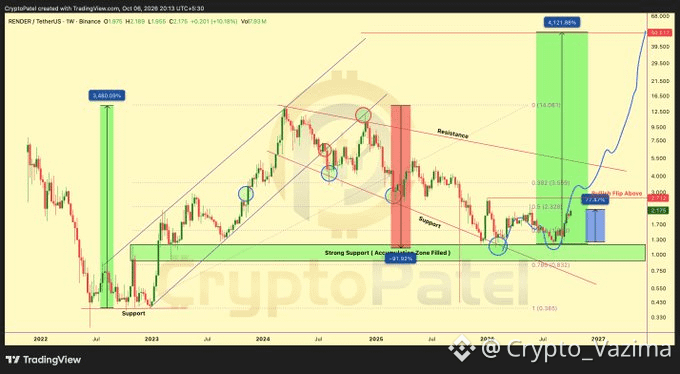
Quiet RENDER Chart, Wild Map If 2.71 Breaks
This is the kind of chart that looks boring until one weekly candle changes the whole story. I am not chasing RENDER here. I want the flip first.
🔥 Why I am watching
- The 1 to 1.20 zone has been defended again and again.
- That base is why the bigger reversal idea is still alive.
- Price is still below the real trigger, so hope is not a plan.
- One clean weekly break can change the mood fast.
🚀 The part that matters
- 2.71 is the bullish flip on this chart.
- A weekly close above it is the signal I actually want.
- Rejection there means the base is still just a base.
- No close, no trade.
🎯 My trade idea
- Bias: Long after the weekly flip
- Trigger: Weekly breakout above 2.71
- Target: 4 first, then 8, 20, and 50 plus if momentum stays alive
- Invalidation: A weekly close back under 1 to 1.20
- Confidence: 65 percent
🛡 Where I step back
- I step back if 2.71 rejects and sellers take control again.
- I also step back if the accumulation zone finally fails.
- Big targets only matter after the break holds.
Are you waiting for 2.71, or do you already like the base? 👇
Tell me where you would place invalidation.
Not investment advice - research on your own! 🚀
$RENDER
This is the kind of chart that looks boring until one weekly candle changes the whole story. I am not chasing RENDER here. I want the flip first.
🔥 Why I am watching
- The 1 to 1.20 zone has been defended again and again.
- That base is why the bigger reversal idea is still alive.
- Price is still below the real trigger, so hope is not a plan.
- One clean weekly break can change the mood fast.
🚀 The part that matters
- 2.71 is the bullish flip on this chart.
- A weekly close above it is the signal I actually want.
- Rejection there means the base is still just a base.
- No close, no trade.
🎯 My trade idea
- Bias: Long after the weekly flip
- Trigger: Weekly breakout above 2.71
- Target: 4 first, then 8, 20, and 50 plus if momentum stays alive
- Invalidation: A weekly close back under 1 to 1.20
- Confidence: 65 percent
🛡 Where I step back
- I step back if 2.71 rejects and sellers take control again.
- I also step back if the accumulation zone finally fails.
- Big targets only matter after the break holds.
Are you waiting for 2.71, or do you already like the base? 👇
Tell me where you would place invalidation.
Not investment advice - research on your own! 🚀
$RENDER