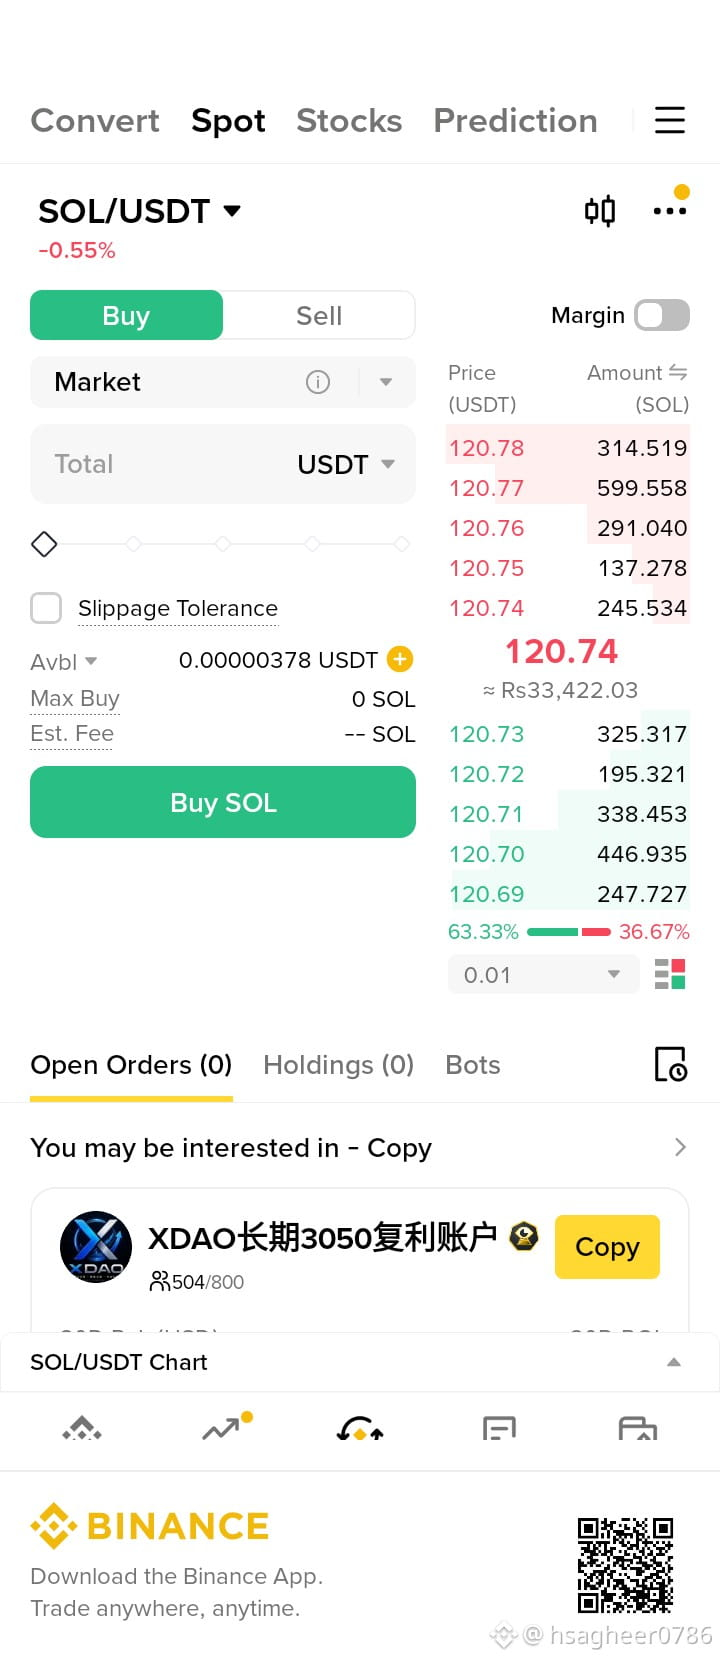
Solana (SOL) Technical Analysis & Actionable Trading Tips
Solana is consolidating in the $120.00 – $122.50 range, holding steady above key short-term demand zones. Higher timeframe market structure remains constructively bullish, but price action is compressing tightly between the $123.50 – $125.00 resistance block and lower trendline support near $118.50.
Key Technical Overview
Moving Averages: Price is trading above both the 4-hour 50 EMA (~$118.80) and 200 EMA (~$115.20), keeping the short-term trend tilted in favor of buyers.
Momentum Indicators:
RSI (14-period): Floating around 55–62 on the 4-hour chart, reflecting healthy momentum without hitting overbought territory.
MACD: Tracking near the zero-line with slight bullish crossover, signaling an impending expansion move once the consolidation breaks.
On-Chain & Catalysts: Strong institutional interest and ongoing net inflows into Solana ETF products continue to absorb sell-side pressure during pullbacks.
Key Levels to Watch
Level TypePrice RangeTechnical ContextMajor Resistance$123.50 – $125.00Overhead supply wall; a 4H close above opens liquidations toward $130+.Immediate Support$118.50 – $119.50Confluence of 50 EMA and lower range demand block.Stronger Support$115.00 – $116.50High-volume node and 200 EMA dynamic support.Invalidation Line$112.00Loss of this structural swing low invalidates the short-term bullish bias.
Actionable Trading Strategies
1. Dip-Buying Strategy (Demand Zone Retest)
Entry Zone: Look for entries on pullback retests near $118.50 – $119.50.
Targets: First target at $123.00, secondary target at $126.50.
Stop Loss: Place stops below $116.20.
2. Breakout Continuation Strategy
Trigger: Wait for a clear 4-hour candle close above $123.50 backed by above-average volume.
Targets: $128.00 and extension target near $135.00.
Stop Loss: Set stop loss just below the breakout trigger base near $120.80.
$BNB
#bnblauncpool #BNB走势 #BNB金鏟子
Solana is consolidating in the $120.00 – $122.50 range, holding steady above key short-term demand zones. Higher timeframe market structure remains constructively bullish, but price action is compressing tightly between the $123.50 – $125.00 resistance block and lower trendline support near $118.50.
Key Technical Overview
Moving Averages: Price is trading above both the 4-hour 50 EMA (~$118.80) and 200 EMA (~$115.20), keeping the short-term trend tilted in favor of buyers.
Momentum Indicators:
RSI (14-period): Floating around 55–62 on the 4-hour chart, reflecting healthy momentum without hitting overbought territory.
MACD: Tracking near the zero-line with slight bullish crossover, signaling an impending expansion move once the consolidation breaks.
On-Chain & Catalysts: Strong institutional interest and ongoing net inflows into Solana ETF products continue to absorb sell-side pressure during pullbacks.
Key Levels to Watch
Level TypePrice RangeTechnical ContextMajor Resistance$123.50 – $125.00Overhead supply wall; a 4H close above opens liquidations toward $130+.Immediate Support$118.50 – $119.50Confluence of 50 EMA and lower range demand block.Stronger Support$115.00 – $116.50High-volume node and 200 EMA dynamic support.Invalidation Line$112.00Loss of this structural swing low invalidates the short-term bullish bias.
Actionable Trading Strategies
1. Dip-Buying Strategy (Demand Zone Retest)
Entry Zone: Look for entries on pullback retests near $118.50 – $119.50.
Targets: First target at $123.00, secondary target at $126.50.
Stop Loss: Place stops below $116.20.
2. Breakout Continuation Strategy
Trigger: Wait for a clear 4-hour candle close above $123.50 backed by above-average volume.
Targets: $128.00 and extension target near $135.00.
Stop Loss: Set stop loss just below the breakout trigger base near $120.80.
$BNB
#bnblauncpool #BNB走势 #BNB金鏟子