$XAU – Liquidation Map (7 Days) – Current Price 4,147
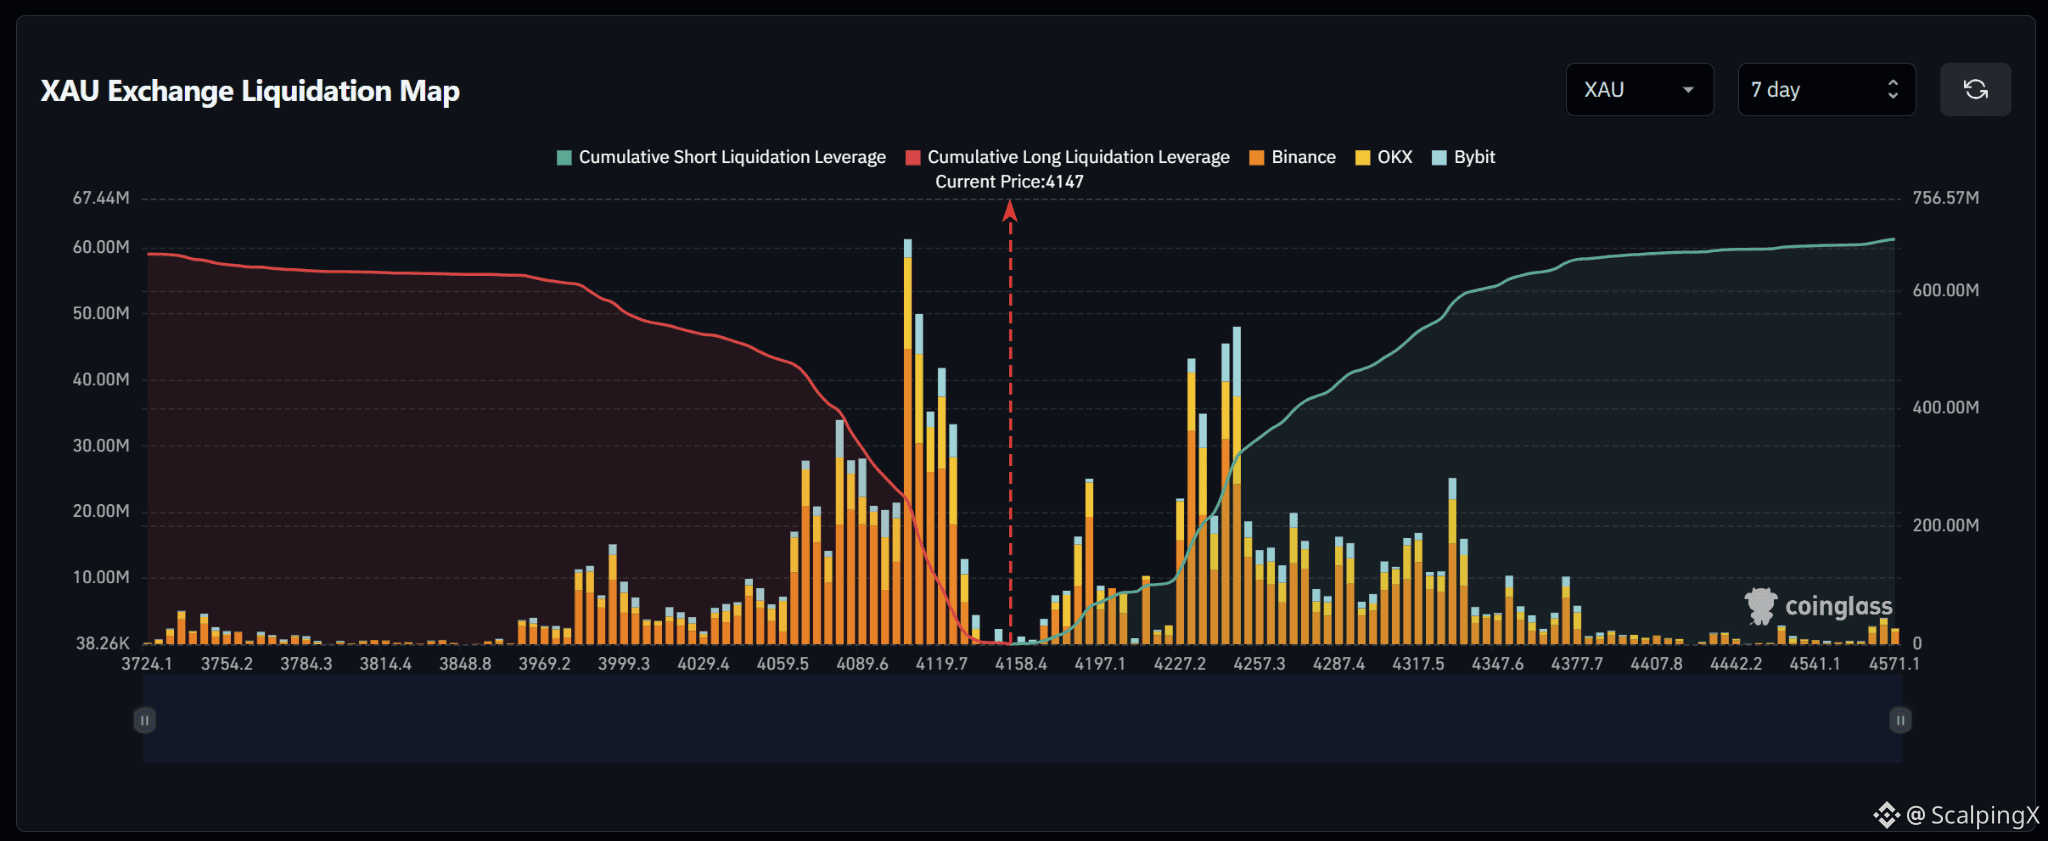
🔎 The 7-day liquidation map is relatively balanced, with roughly 690–700 million USD in short liquidations above the current price, slightly exceeding approximately 660–670 million USD in long liquidations below. The overall structure therefore carries a mild upside tilt rather than a strong imbalance.
📉 Below the market, long-liquidation liquidity is concentrated heavily across 4,060–4,120. The strongest cluster sits around 4,095–4,115, with the largest bar above 60 million USD, while 4,070–4,090 also contains several bars around 20–35 million USD. Losing 4,120–4,110 would shift attention toward 4,090–4,070 and then 4,060.
📈 Above the market, short-liquidation liquidity is concentrated across 4,220–4,260. The strongest cluster sits around 4,230–4,250 with several bars around 35–48 million USD; closer to price, 4,190–4,200 contains a bar near 25 million USD. Further out, 4,280–4,340 continues to hold several notable liquidity layers.
🧭 The broader setup is close to balanced but carries a mild upside tilt. Breaking above 4,190–4,200 would expose 4,220–4,260, followed by 4,280–4,340. Losing 4,120–4,110 would instead increase the probability of a sweep toward 4,090–4,070.
#LiquidationMap
🔎 The 7-day liquidation map is relatively balanced, with roughly 690–700 million USD in short liquidations above the current price, slightly exceeding approximately 660–670 million USD in long liquidations below. The overall structure therefore carries a mild upside tilt rather than a strong imbalance.
📉 Below the market, long-liquidation liquidity is concentrated heavily across 4,060–4,120. The strongest cluster sits around 4,095–4,115, with the largest bar above 60 million USD, while 4,070–4,090 also contains several bars around 20–35 million USD. Losing 4,120–4,110 would shift attention toward 4,090–4,070 and then 4,060.
📈 Above the market, short-liquidation liquidity is concentrated across 4,220–4,260. The strongest cluster sits around 4,230–4,250 with several bars around 35–48 million USD; closer to price, 4,190–4,200 contains a bar near 25 million USD. Further out, 4,280–4,340 continues to hold several notable liquidity layers.
🧭 The broader setup is close to balanced but carries a mild upside tilt. Breaking above 4,190–4,200 would expose 4,220–4,260, followed by 4,280–4,340. Losing 4,120–4,110 would instead increase the probability of a sweep toward 4,090–4,070.
#LiquidationMap