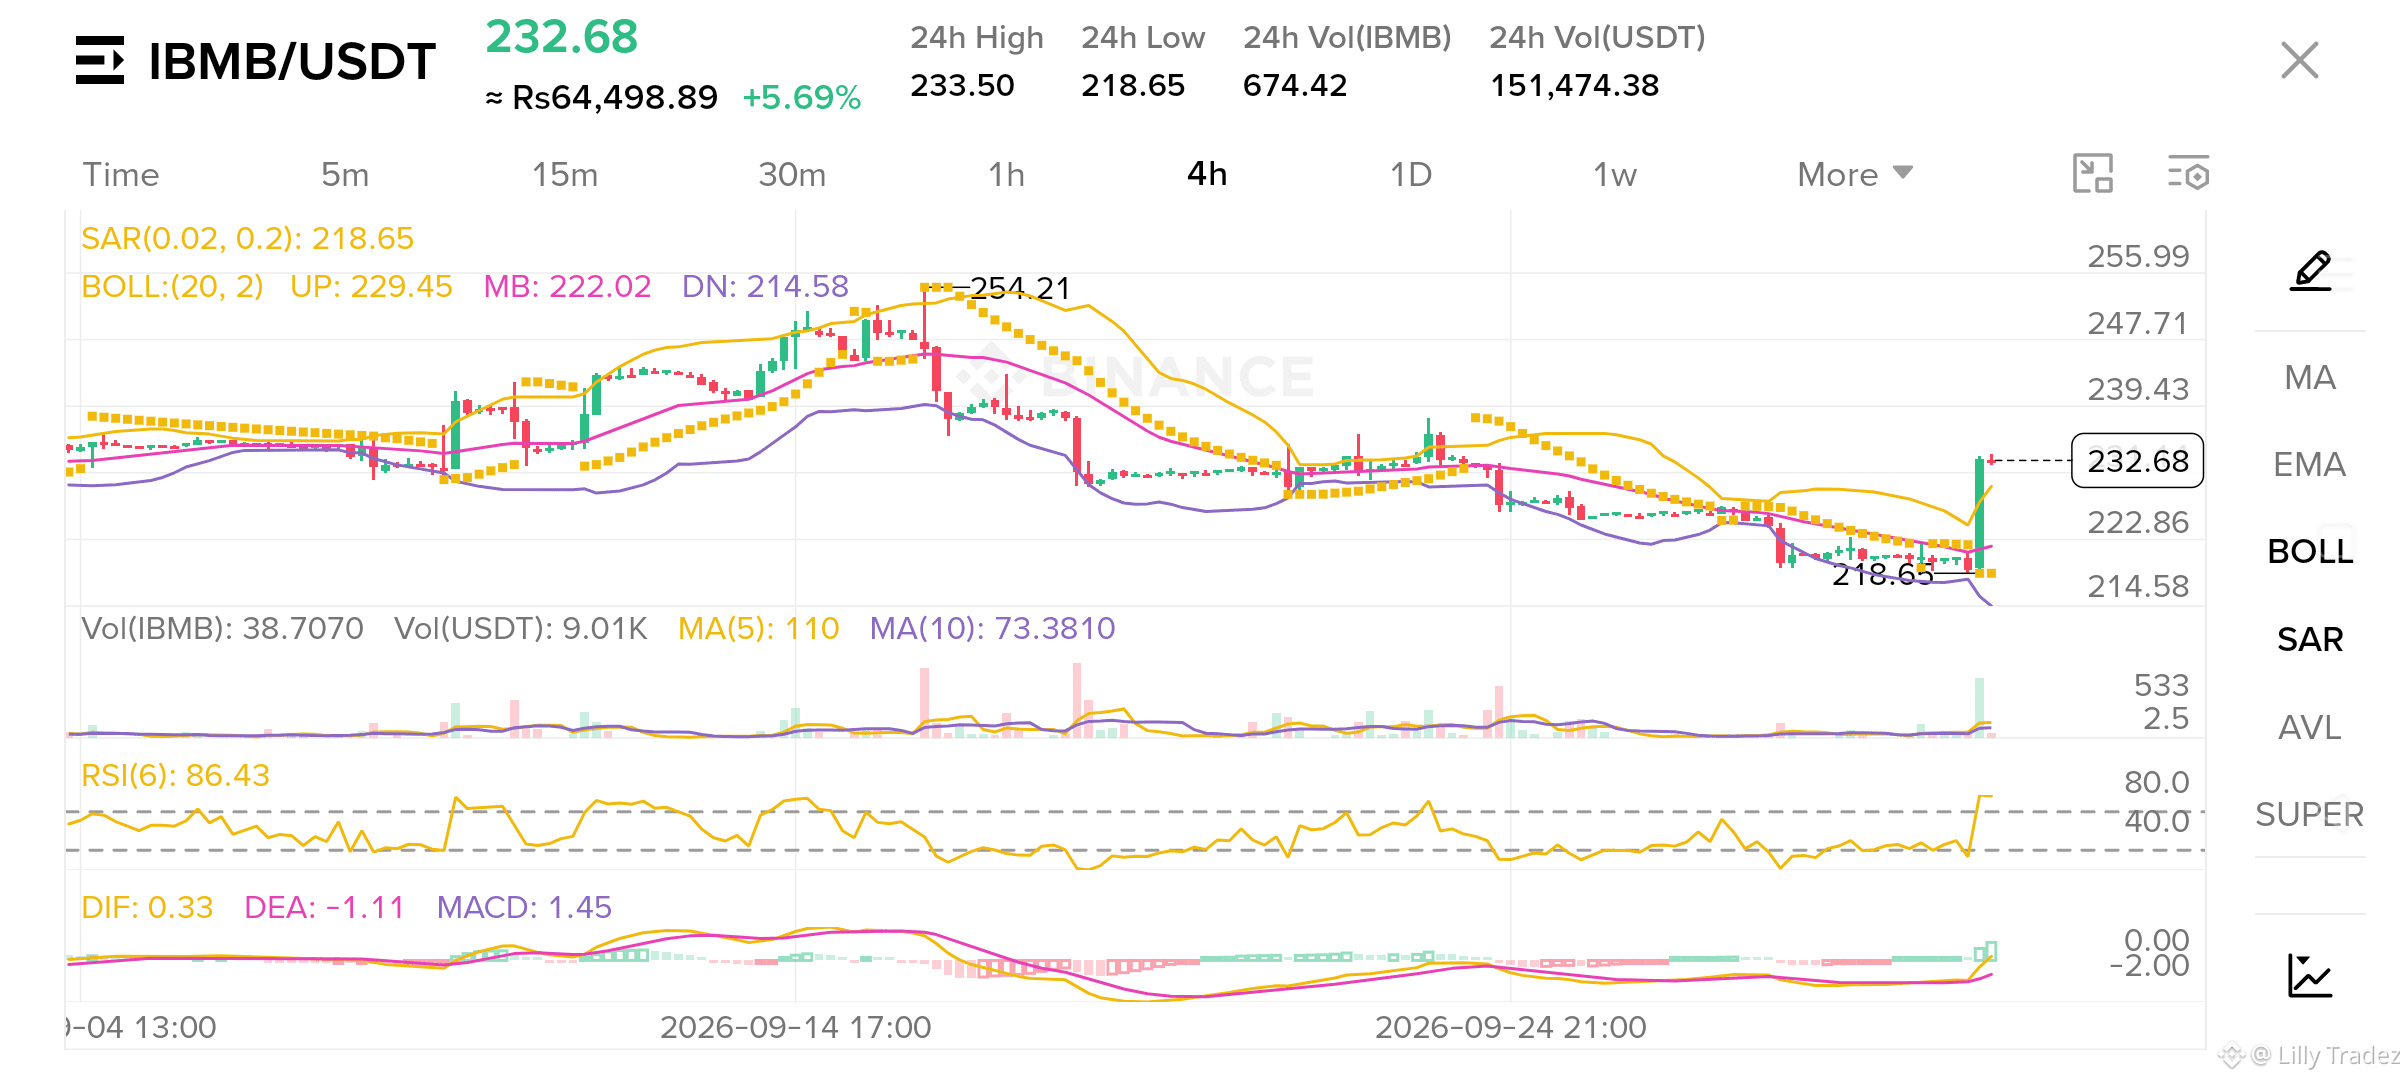
🔍 $IBMB MB/USDT 4H Analysis: Is the Bottom In for IBMB?
After a sustained downtrend from the $254.21 local high down to the $218.65 bottom, $IBMB is finally flashing signs of life with a fast liquidity spike up to $232.68!
Let’s analyze the key technical factors:
1️⃣ Volume & Bollinger Bands Expansion:
After squeezing tightly between $214 and $222, the Bollinger Bands are expanding again. The current 4H candle cleanly popped above the Upper Band ($229.45) on an uptick in volume.
2️⃣ Overbought RSI Caution:
The 6-period RSI rocketed to 86.43. High RSI confirms strong momentum, but historical moves on this chart show that sharp spikes often face profit-taking before setting a higher low.
3️⃣ Moving Averages & Trend Alignment:
24h High: $233.50
24h Low: $218.65
MACD: Flipping positive ($1.45), indicating early bullish reversal momentum on the 4H timeframe.
📌 Summary:
A solid 4H candle close above $230.00 keeps the bullish structure intact for a push toward $239.40 and $247.70. However, keep strict stop-losses below $218.60 in case this is a fakeout pump.
Are you holding $IBMB or taking profit here? Let’s discuss in the comments! 💬
After a sustained downtrend from the $254.21 local high down to the $218.65 bottom, $IBMB is finally flashing signs of life with a fast liquidity spike up to $232.68!
Let’s analyze the key technical factors:
1️⃣ Volume & Bollinger Bands Expansion:
After squeezing tightly between $214 and $222, the Bollinger Bands are expanding again. The current 4H candle cleanly popped above the Upper Band ($229.45) on an uptick in volume.
2️⃣ Overbought RSI Caution:
The 6-period RSI rocketed to 86.43. High RSI confirms strong momentum, but historical moves on this chart show that sharp spikes often face profit-taking before setting a higher low.
3️⃣ Moving Averages & Trend Alignment:
24h High: $233.50
24h Low: $218.65
MACD: Flipping positive ($1.45), indicating early bullish reversal momentum on the 4H timeframe.
📌 Summary:
A solid 4H candle close above $230.00 keeps the bullish structure intact for a push toward $239.40 and $247.70. However, keep strict stop-losses below $218.60 in case this is a fakeout pump.
Are you holding $IBMB or taking profit here? Let’s discuss in the comments! 💬