




Bitcoin Next Move Analysis | September 30, 2026
By Muhammad Rana Rizwan
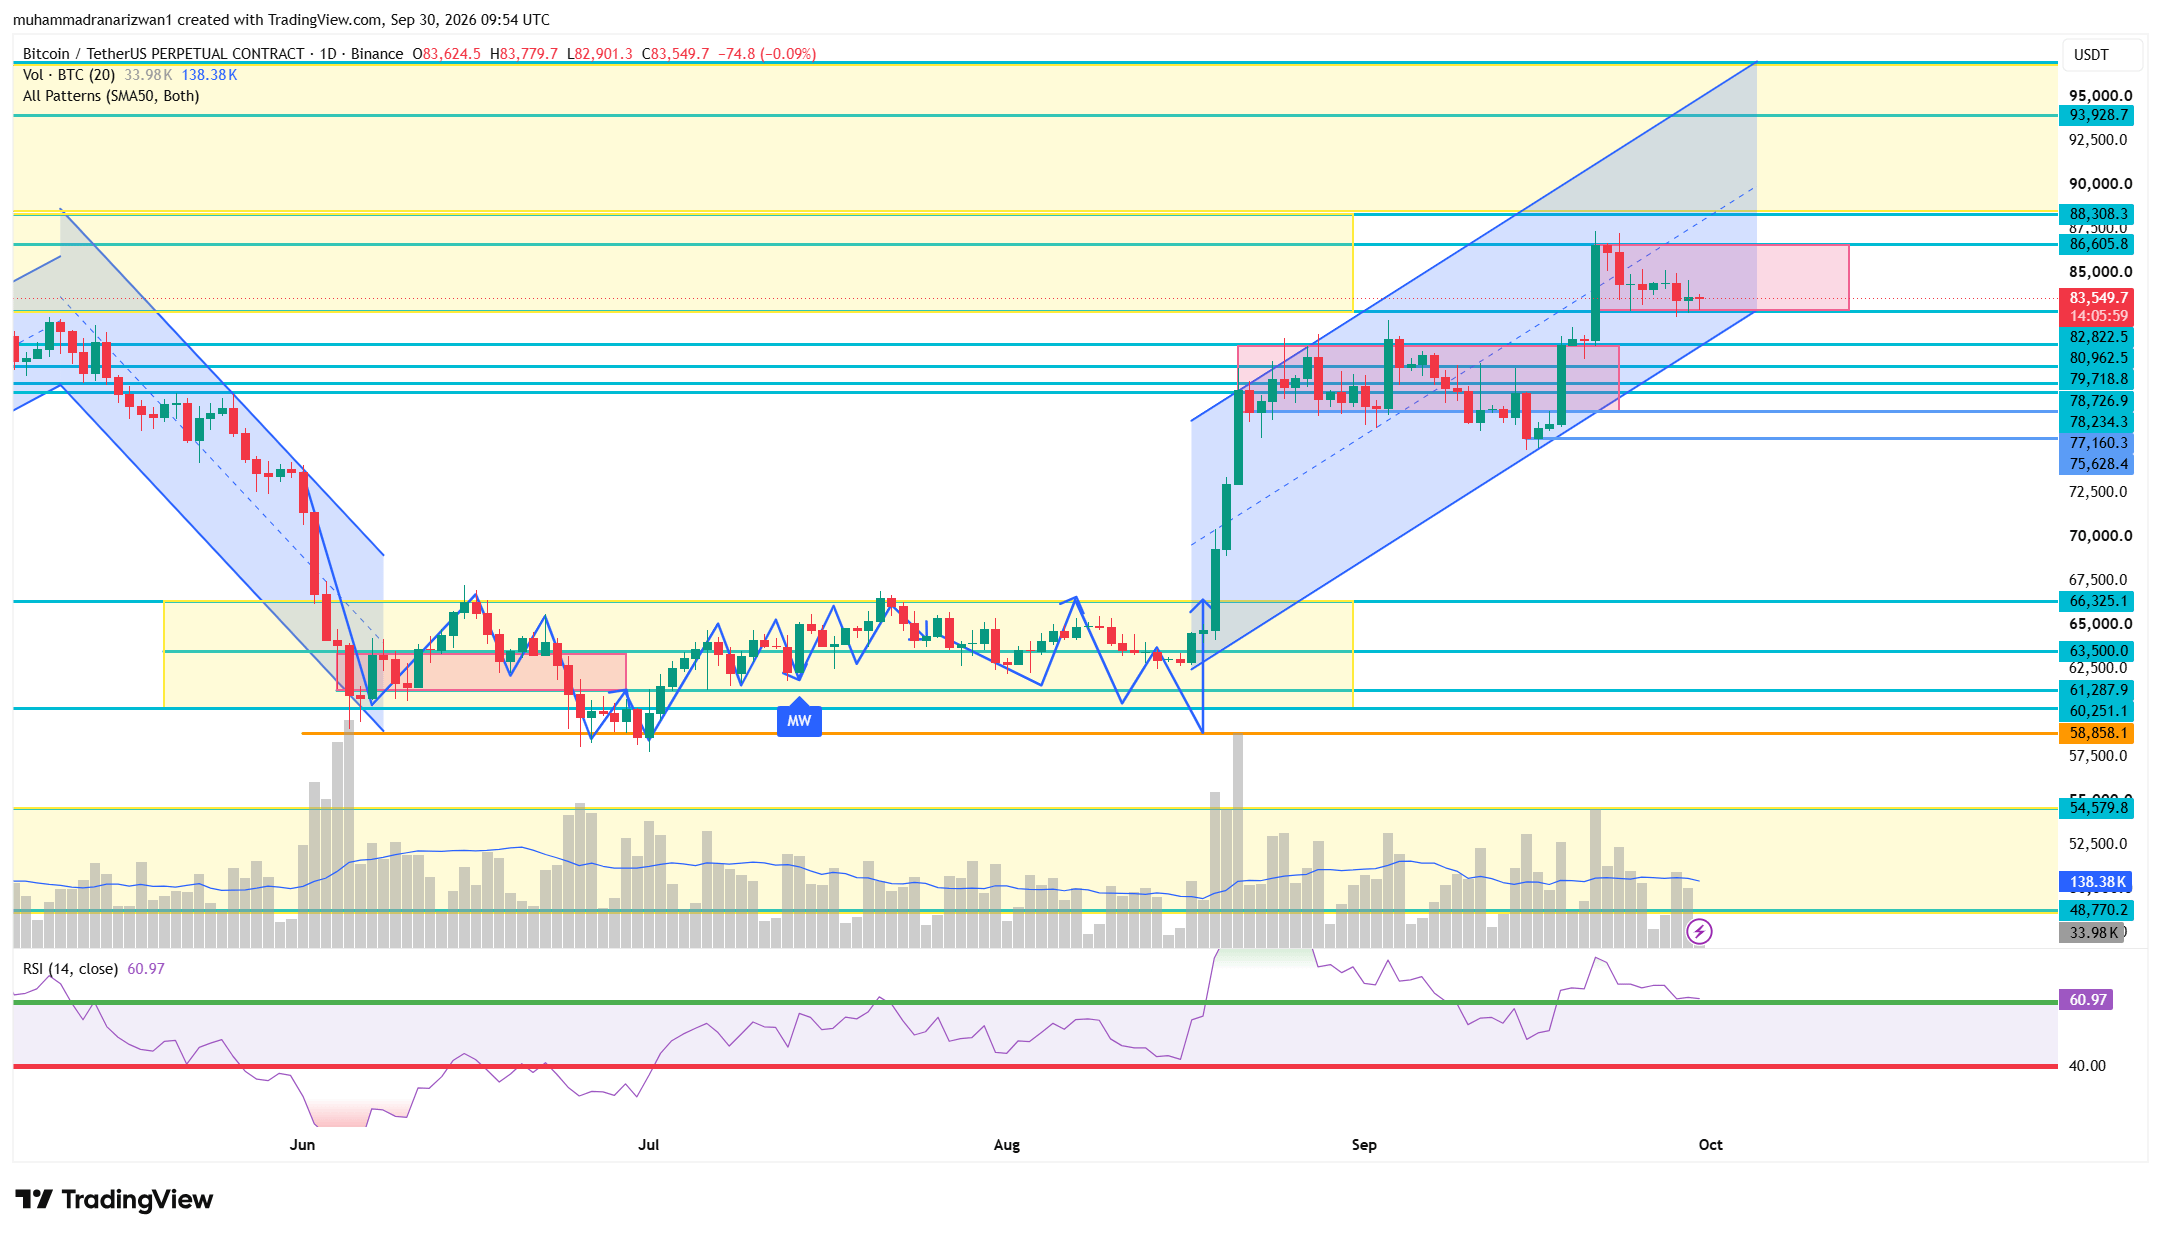
Bitcoin is trading near $83,550 in the chart snapshot, following a pullback from the $86,600 region. The broader daily structure remains bullish inside the marked ascending channel, but short-term momentum has cooled.
The key question today: can buyers defend $82,822 and push BTC through $84,231, or will support failure expose liquidity near $82,225?
Here is the technical outlook and the conditional trading plan.
📊 1. Daily Structure: Uptrend Intact, Buyers Under Pressure
BTC has advanced strongly from its earlier consolidation and continues to trade inside an ascending channel.
However, the recent rejection around $86,606 has produced several corrective daily candles. Price is now approaching the lower portion of the channel, making the current support area important.
Holding this area would support a recovery attempt. A confirmed break below it would increase the risk of a deeper correction.
My current bias is cautiously bullish above $82,822, with confirmation needed before expecting stronger upside.
📈 2. Momentum: Daily Strength, Short-Term Consolidation
The daily chart shows RSI near 60.97. This suggests positive broader momentum, although RSI has eased from its recent peak.
The accompanying dashboard shows:
• Daily BTC RSI: approximately 61.
• 4-hour RSI: approximately 49.
• 1-hour RSI: approximately 53.
This combination suggests that the daily trend remains stronger than the immediate trading momentum. BTC may need further consolidation or a support retest before another sustained move higher.
The current daily candle is unfinished. Its volume should not be directly compared with completed daily candles to confirm a breakout or breakdown.
💧 3. Liquidity Levels to Watch
The supplied dashboard highlights potential liquidity areas near:
• $83,916 and $84,231 above the snapshot price.
• $82,579 and $82,225 below the snapshot price.
These are areas to monitor for acceleration, rejection or a liquidity sweep. They are estimates, not guaranteed destinations, and the dashboard’s long/short labels are inconsistent.
Two possible paths deserve attention:
An upward move into $83,916–$84,231 could develop into a breakout if buyers hold above that zone. A rejection there could send price back toward support.
Alternatively, BTC could sweep below $82,822 toward $82,579–$82,225. A quick reclaim would improve the recovery case; continued trading below support would favour further downside.
Neither sequence is confirmed yet.
🎯 4. Important Price Levels
Immediate support:
$82,822
Lower liquidity/support area:
$82,579–$82,225
Further downside levels:
$80,963
$79,719
$78,727–$78,234
$77,160
Immediate upside hurdles:
$83,916–$84,231
Major resistance:
$86,606
Higher resistance:
$88,308
Extended daily-chart resistance:
$93,929
The higher resistance levels are broader continuation references. They should not be treated as guaranteed targets for today.
🌍 5. Market Context: Mixed Signals
The supplied dashboard reports a crypto Fear & Greed reading of 29, indicating cautious sentiment. It also shows total crypto market capitalisation declining from approximately $2.88 trillion to $2.86 trillion.
That market-cap decline represents a change in market valuation; it does not prove that exactly $20 billion in cash exited crypto.
The dashboard also reports positive BTC spot ETF net inflows of approximately $66.19 million. This is potentially supportive, but the reporting period should be verified before treating it as today’s completed flow.
Together, these readings suggest a mixed backdrop: supportive institutional demand in the reported data, alongside weaker broader sentiment.
Price confirmation remains essential.
🟢 6. Conditional Long Signal: Support Hold and Reclaim
This setup becomes relevant only if BTC tests support, rejects lower prices and reclaims the entry area.
Entry zone:
$82,900–$83,100
Confirmation:
Wait for a 1-hour candle to reclaim $82,900 after a support test, followed by a retest that holds. Skip the entry if price continues accepting below $82,822.
Stop-loss:
$82,150
Take-profit levels:
TP1: $83,916
TP2: $84,231
TP3: $85,000
TP4: $86,606
At a reference entry of $83,000, the stop distance is $850 per BTC. TP2 offers approximately 1.45:1 reward-to-risk, while TP3 offers approximately 2.35:1, before fees and slippage.
TP1 is an early partial-profit area. Traders requiring at least 2:1 reward-to-risk should assess whether a move toward TP3 is realistic before entering.
This is a support-recovery setup, not an instruction to buy immediately at market.
🔴 7. Conditional Short Signal: Breakdown and Failed Retest
The bearish setup becomes relevant if buyers lose $82,822 and fail to recover it.
Entry zone:
$82,650–$82,800
Confirmation:
Wait for a 1-hour close below $82,822, then a failed retest from underneath. Avoid entering solely because of a brief wick below support.
Stop-loss:
$83,250
Take-profit levels:
TP1: $82,225
TP2: $80,963
TP3: $79,719
At a reference entry of $82,700, the stop distance is $550 per BTC. TP2 offers approximately 3.16:1 reward-to-risk before fees and slippage.
The bearish case weakens if BTC reclaims $82,822 and holds above it.
🚀 8. What Would Confirm Stronger Upside?
A convincing recovery requires BTC to break above $84,231 and hold that level on a retest, ideally with stronger completed-candle volume.
That would improve the case for a move toward $85,000 and potentially $86,606.
A sustained break above $86,606 would bring $88,308 into focus. Until those confirmations appear, an upward move can still be a bounce within the recent correction.
🛡️ 9. Risk Management
Use one confirmed setup at a time. Both signals remain inactive until their conditions occur.
Keep planned account risk small—for example, 0.5% per trade—and calculate position size from the entry-to-stop distance. Include fees and potential slippage.
Leverage should not determine how much you are willing to lose. Avoid increasing size after a losing trade or chasing price after it has already moved beyond the planned entry.
If neither setup confirms, waiting is a valid trading decision.
📝 My BTC Outlook for Today
Above $82,822, BTC retains a cautiously bullish recovery case, with $83,916–$84,231 as the first important upside test.
A confirmed hold above $84,231 would strengthen the continuation case toward $85,000 and $86,606.
Below $82,822, watch $82,579–$82,225 closely. A failed recovery could expose $80,963.
The daily trend remains constructive, but today’s direction depends on how price reacts at support and nearby liquidity. Let the candle close and the retest confirm the trade.
This analysis reflects the September 30 chart snapshot. Trade setups are educational scenarios, carry risk and may become invalid as price changes.
#bitcoin #BTC #BTCUSDTAnalysis #CryptoTradingInsights #muhammadranarizwan $BNB
