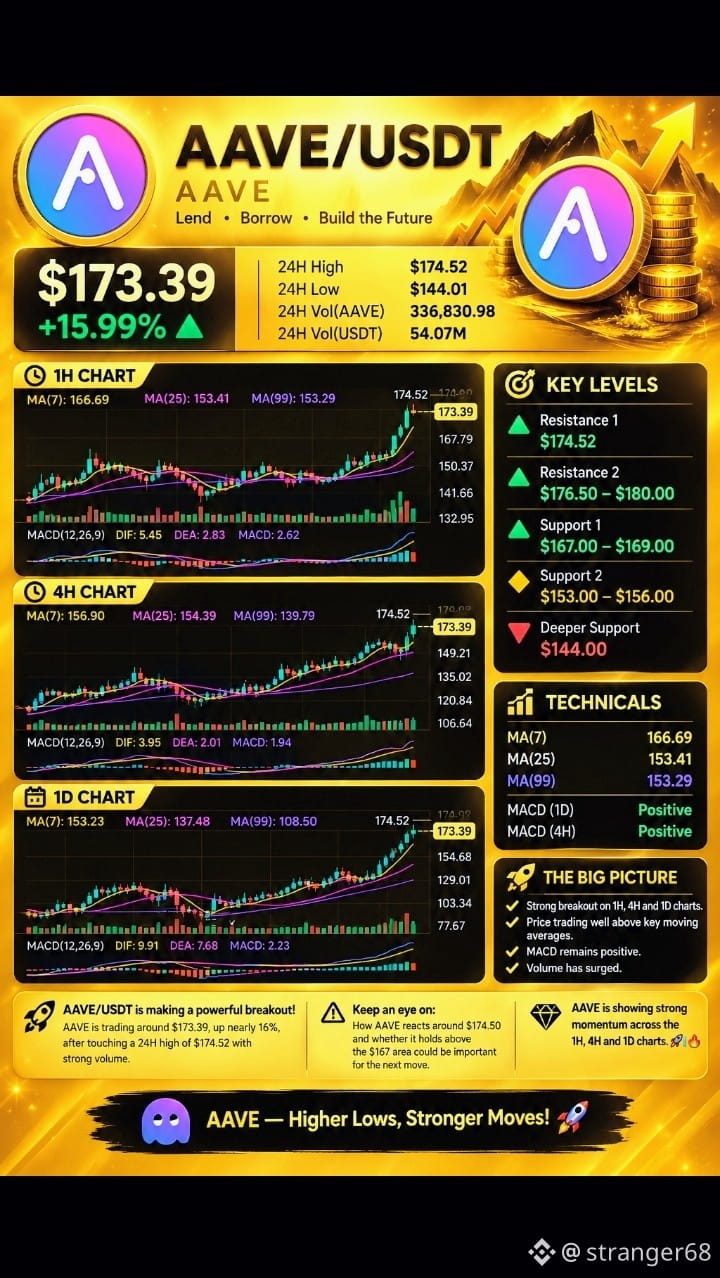
🚀 $AAVE is making a powerful breakout!
AAVE is trading around $173.39, up nearly 16%, after touching a 24H high of $174.52 with strong volume. 📈
⏱️ 1H Chart: AAVE has surged sharply above its moving averages, with MA(7) $166.69, MA(25) $153.41, and MA(99) $153.29. MACD is strongly positive, showing strong short-term momentum. ⚡
🕓 4H Chart: The trend remains elevated, with price well above MA(7) $156.90, MA(25) $154.39, and MA(99) $139.79. Rising volume and positive MACD support the current momentum. 🔥
📅 1D Chart: The daily structure shows an even larger breakout, with AAVE trading above MA(7) $153.23, MA(25) $137.48, and MA(99) $108.50. Daily MACD remains positive as price approaches the $174.52 high. 📊
🎯 Key levels to watch:
🔸 $174.52 — current 24H high
🔸 $176.50–$180.00 — potential upside area
🔸 $167–$169 — near-term support
🔸 $153–$156 — major moving-average zone
🔸 $144 — important downside level
⚠️ After such a rapid move, volatility can remain elevated, so watching how AAVE reacts around $174.50 and whether it holds above the $167 area could be important for the next move.
💎 AAVE is showing strong momentum across the 1H, 4H, and 1D charts. 🚀📊🔥
#EarningsSeason #OpenAIDelaysGPT6.1OverSafetyIssues #BitMineETHHoldingsTop6Million #BitgetHackerFailsToMoveStolenFunds
AAVE is trading around $173.39, up nearly 16%, after touching a 24H high of $174.52 with strong volume. 📈
⏱️ 1H Chart: AAVE has surged sharply above its moving averages, with MA(7) $166.69, MA(25) $153.41, and MA(99) $153.29. MACD is strongly positive, showing strong short-term momentum. ⚡
🕓 4H Chart: The trend remains elevated, with price well above MA(7) $156.90, MA(25) $154.39, and MA(99) $139.79. Rising volume and positive MACD support the current momentum. 🔥
📅 1D Chart: The daily structure shows an even larger breakout, with AAVE trading above MA(7) $153.23, MA(25) $137.48, and MA(99) $108.50. Daily MACD remains positive as price approaches the $174.52 high. 📊
🎯 Key levels to watch:
🔸 $174.52 — current 24H high
🔸 $176.50–$180.00 — potential upside area
🔸 $167–$169 — near-term support
🔸 $153–$156 — major moving-average zone
🔸 $144 — important downside level
⚠️ After such a rapid move, volatility can remain elevated, so watching how AAVE reacts around $174.50 and whether it holds above the $167 area could be important for the next move.
💎 AAVE is showing strong momentum across the 1H, 4H, and 1D charts. 🚀📊🔥
#EarningsSeason #OpenAIDelaysGPT6.1OverSafetyIssues #BitMineETHHoldingsTop6Million #BitgetHackerFailsToMoveStolenFunds