

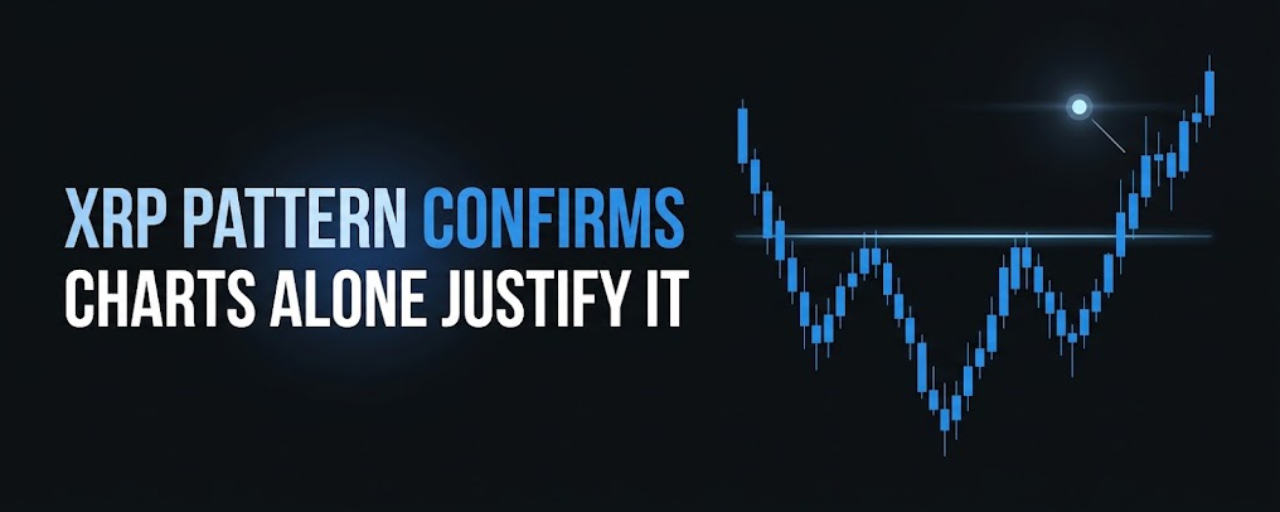

A neckline near $1.55, a target near $5.40. Here's the pattern, and the one detail about Brandt's own XRP trading that's worth knowing first.
📐 A chartist with nearly five decades of experience just said XRP doesn't need a community, a narrative, or anyone's approval to justify buying it. The charts alone are enough, in his words.
Peter Brandt said XRP holders don't need what he called certified cult membership to justify owning the token. His point was that the technical setup itself, without any hype attached, makes a real case.
📊 Here's the pattern he's pointing to.
Analysts have identified an inverse head-and-shoulders formation on XRP's chart, with a neckline near 1.55. This pattern forms from three troughs, with the middle one lowest, and it's considered bullish once price breaks and holds above the neckline. Brandt's own long-term chart points toward roughly 5.40 as an eventual target, while XRP was trading around 1.52 at the time, essentially sitting right at that critical neckline.
🎯 A breakout above that level, according to the setup, could open the door toward 2 dollars as a nearer-term move.
⚖️ Here's the detail worth knowing before you weight this call too heavily.
Brandt has covered XRP's chart repeatedly over the years, sometimes bullish, sometimes flagging bearish head-and-shoulders patterns pointing sharply lower. Both calls have appeared at different points, which isn't a contradiction, it's just how technical analysis works, patterns evolve as new price data comes in.
There's a more interesting detail, though. Brandt has said in the past that he personally doesn't trade XRP, because he considers it a security issued by Ripple Labs, and he doesn't trade OTC securities as a matter of personal policy. He's commented that if he did trade such assets, XRP would genuinely interest him. That's a meaningful distinction, he's willing to analyze and discuss the chart publicly while choosing not to act on it himself.
🧠 Why does that distinction actually matter for you?
Because it separates the analysis from the endorsement. A chartist calling out a bullish pattern is offering a read on price structure, not necessarily a personal vote of confidence in the asset itself. Understanding that difference helps you weigh the call for what it actually is, technical observation, rather than treating it as a personal recommendation from someone putting their own money behind it.
✅ What this means for you
If you're holding XRP, this pattern and target are genuinely bullish technical context, alongside whale accumulation and steady ETF inflows that have been building. But remember this is one interpretation of a chart, and Brandt himself has flagged bearish patterns on the same asset before.
If you're on the sidelines, the neckline level matters more than the price target. Watching whether XRP holds and closes above roughly 1.55 on a weekly basis is the actual confirmation this pattern needs, not the eventual 5.40 figure.
If you're building real technical analysis skill, this is a good study case, inverse head-and-shoulders patterns are genuinely powerful when they complete cleanly, but they can also fail or get reinterpreted as new price action comes in. Watching how these plays out live is more useful than memorizing the target alone.
🟢 Bullish scenario
XRP holds firmly above the neckline, the pattern completes as described, and price works toward the 2-dollar level first, with 5.40 remaining the longer-term target if momentum continues.
🔴 Risk scenario
XRP fails to hold the neckline support, the pattern doesn't confirm, and price retraces, which would be consistent with some of Brandt's earlier bearish chart calls on the same asset.
👀 Three things to watch
1️⃣ Weekly close above the neckline
Does XRP confirm a clean weekly close above roughly 1.55, or does it stay below?
2️⃣ ETF and whale flow data
Do inflows and accumulation continue supporting the bullish technical setup?
3️⃣ Brandt's own follow-up
Does he continue to reference this pattern as price develops, or does he flag a shift if the setup breaks down?
💡 The key takeaway
A respected chartist is pointing at a real, textbook-style bullish pattern on XRP's weekly chart. That's worth understanding on its own terms.
But the same analyst has flagged bearish patterns on this exact asset before and notably chooses not to trade it himself. The chart is one input. What you do with it is still your call.
That is the part worth watching.
This post is for informational and educational purposes only and is not financial advice. Crypto markets are volatile. Always conduct your own research before making financial decisions.
#BinanceSquare #XRP #TechnicalAnalysis #Crypto #PeterBrandt
