
OVERVIEW
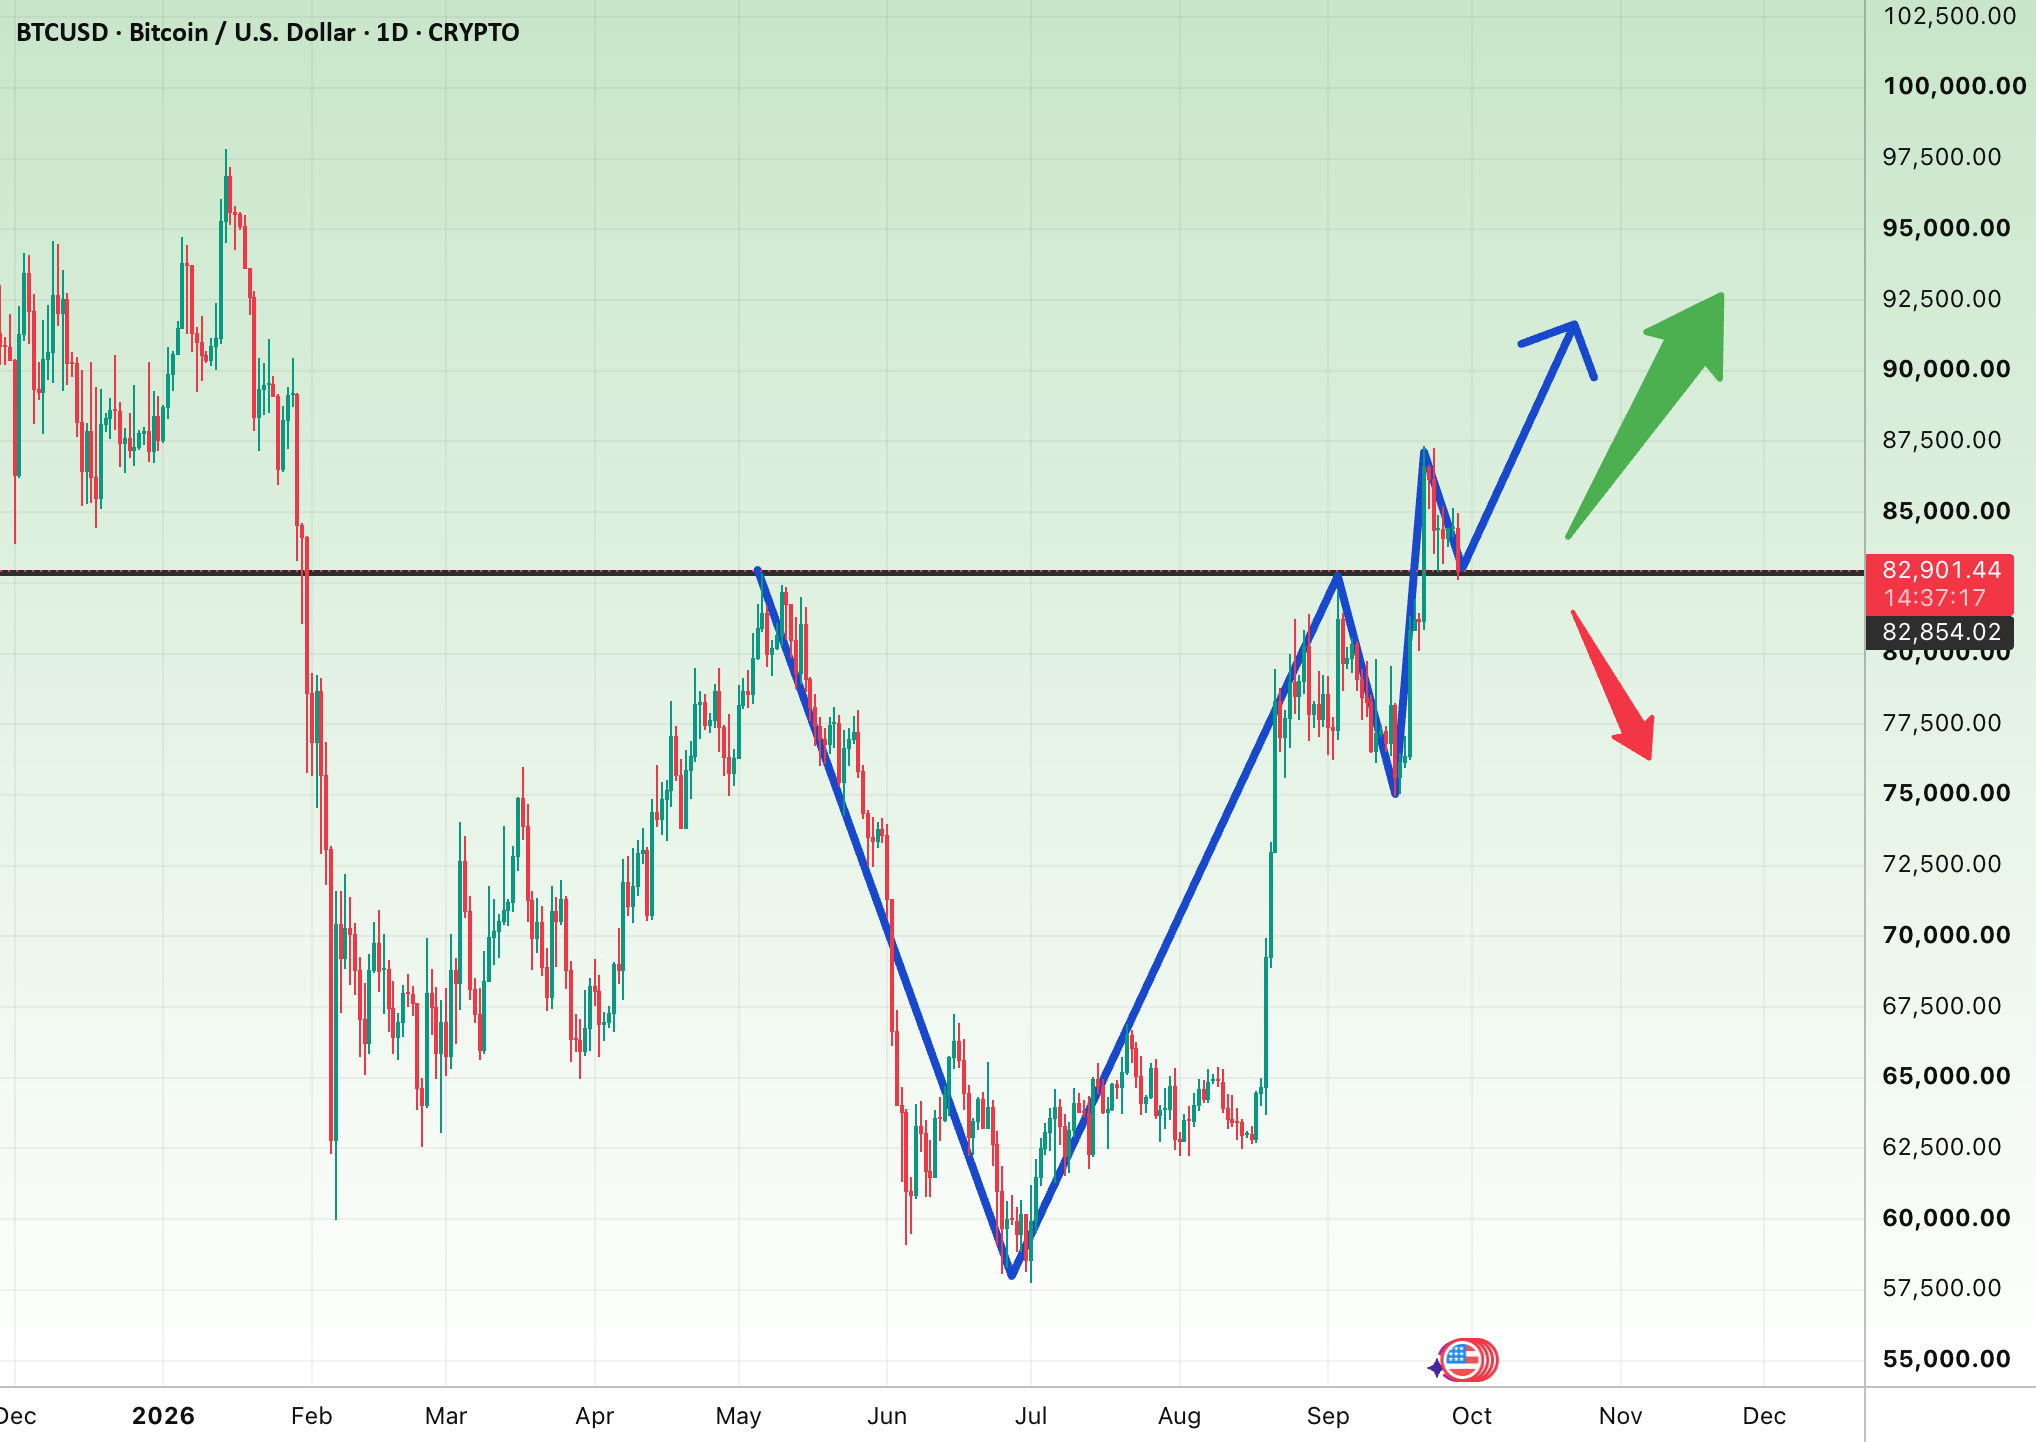
Bitcoin (BTCUSD) on the daily chart is testing a critical horizontal baseline resistance-turned-support around 82,857, following a recent impulsive rally toward the 87,000 region and a subsequent cooling phase[span_0](start_span)[span_0](end_span). Price is currently hovering at 82,857.69 (-1.89%) right on the key level[span_1](start_span)[span_1](end_span). While the primary directional bias (larger green arrow) favors a continuation toward the 92,000+ supply zones, confirmation strictly requires a successful defense of this pivot and a rebound away from the boundary.
FUNDAMENTAL SNAPSHOT
The broader crypto market continues to navigate a balance between institutional spot ETF demand and profit-taking pressures from long-term holders. Macro liquidity conditions, shifting US Treasury yields, and ongoing regulatory updates remain central focal points for market participants. The upcoming monthly close and shifting derivatives open interest will serve as the primary short-term catalysts for price direction.
KEY OBSERVATIONS
- The black horizontal line at 82,857 marks a major structural pivot that previously acted as a key reaction ceiling and is now being retested.
- The blue zigzag outlines a strong recovery structure following the mid-2026 capitulation low near 58,000 and subsequent higher lows.
- The latest daily session formed a moderate red candle (O: 84,455.24, H: 84,972.01, L: 82,600.72, C: 82,857.69, -1.89%), tapping directly into the support zone[span_2](start_span)[span_2](end_span).
- The primary scenario (larger green arrow) projects an upward expansion toward the 92,000 and 95,000 psychological supply regions[span_3](start_span)[span_3](end_span).
- Immediate overhead resistance stands near the recent swing high around 87,300, while downside risk opens toward the 78,000 support shelf if the baseline fails[span_4](start_span)[span_4](end_span).
SHORT-TERM VIEW (Bullish bias following successful support defense)
Entry: 83,000–84,500 (on a confirmed bullish rejection candle or reclaim above 83,500)
TP1: 87,000 (recent swing high resistance)
TP2: 92,000 (primary upward arrow objective and psychological milestone)
Stop Loss: 81,200 (below the recent swing low and local structure)
Invalidation: Daily close below 81,000
Risk/Reward: ~1:1.6 to TP1, ~1:3.4 to TP2
Alternative scenario (lower probability): Bearish breakdown below baseline support
Entry: 81,500–82,500 | TP1: 78,000 | TP2: 75,000
Stop Loss: 84,200
Risk/Reward: ~1:1.8 to TP1, ~1:2.9 to TP2
LONG-TERM VIEW (Bullish trend continuation upon confirmed structural hold)
Holding the multi-month baseline pivot keeps the broader macro recovery structure intact, targeting an expansion toward cyclical highs.
Entry: 82,000–84,000
TP1: 92,000 (major overhead resistance)
TP2: 100,000 (macro psychological milestone outside current chart window)
Stop Loss: 77,500 (below structural swing base)
Invalidation: Weekly close below 77,500
Risk/Reward: ~1:1.6 to TP1, ~1:2.6 to TP2
DISCLAIMER
This analysis is for educational purposes only and is not financial advice. Trading crypto involves significant risk. Always do your own research and manage your risk.