🚨 #zec — NEXT 3 DAYS TECHNICAL SETUP 🚨#ZECUSDT
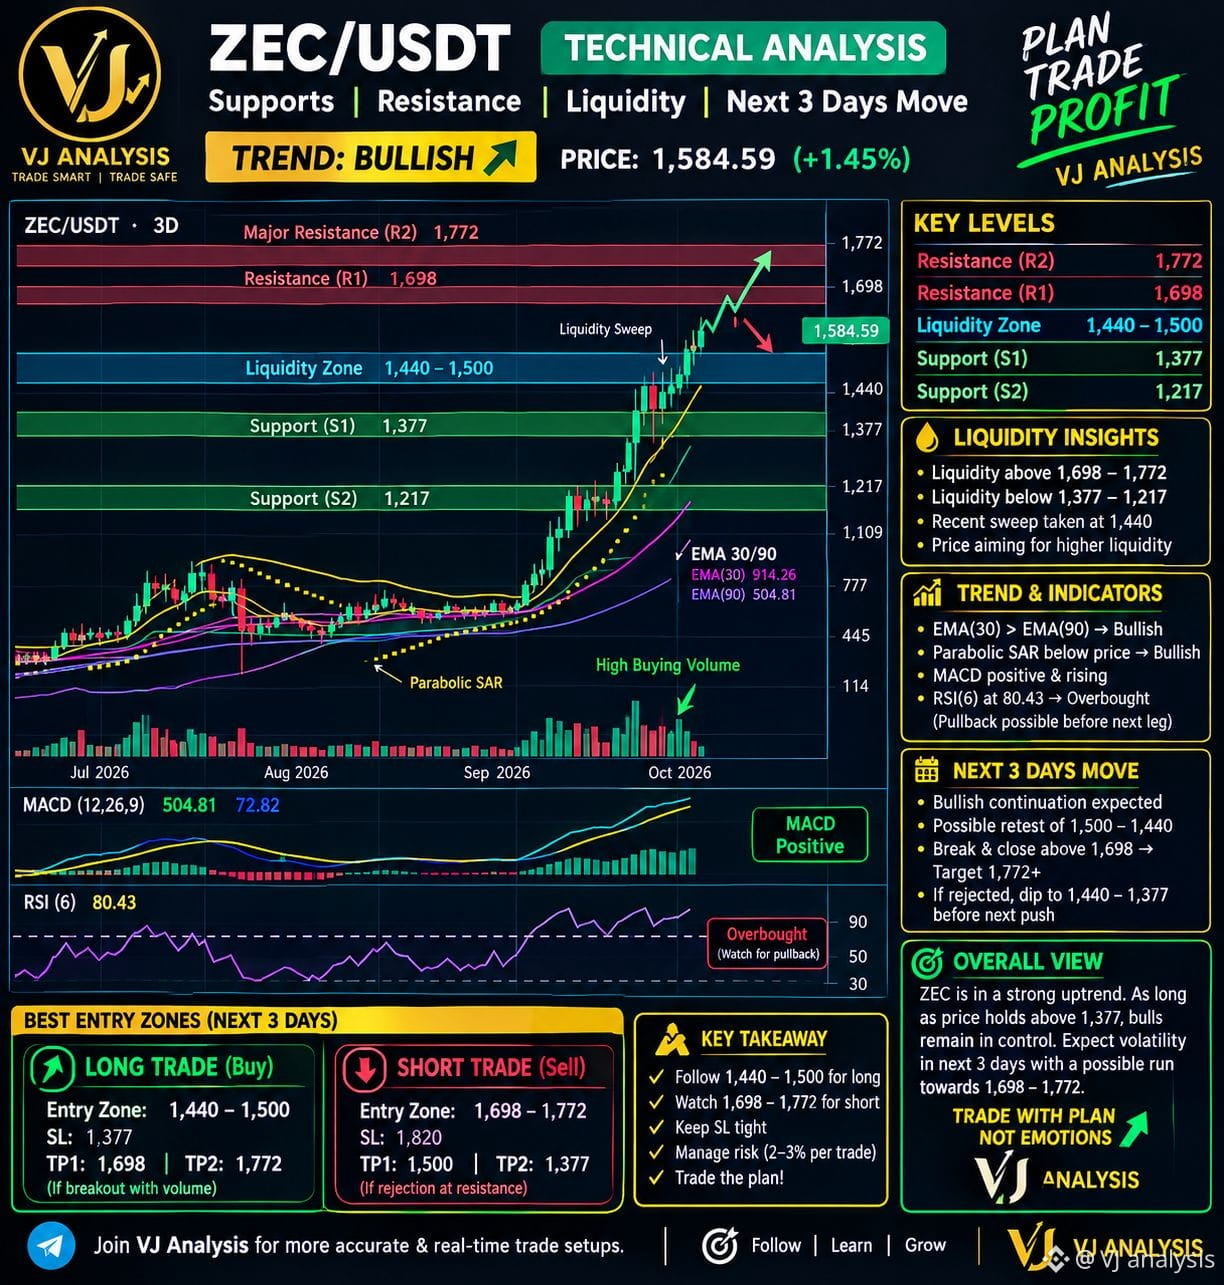
$ZEC is trading around 1,584.59, with price still holding a strong bullish structure on the 3D chart. Momentum remains elevated, but RSI around 80 shows the market is stretched — meaning a pullback can happen before the next major expansion.
📈 TREND: BULLISH
Key resistance: 🔴 R1: 1,698 🔴 R2: 1,772
These are the major upside liquidity areas. A strong breakout and close above 1,698 could open the way toward 1,772+.
🟦 LIQUIDITY / RETEST ZONE 1,440 – 1,500
This is the area to watch if price pulls back. A reaction from this zone could provide a more controlled long setup rather than chasing the current move.
🟢 SUPPORT S1: 1,377 S2: 1,217
As long as price maintains the higher-support structure, the broader trend remains constructive.
🔥 LONG SETUP Entry zone: 1,440–1,500 SL: Below 1,377 TP1: 1,698 TP2: 1,772+
Confirmation: bullish reaction + volume expansion.
⚠️ SHORT SETUP Watch 1,698–1,772 for rejection. Potential targets: 1,500 → 1,377 Invalidation: sustained breakout above the resistance zone.
📊 INDICATORS EMA structure remains bullish, Parabolic SAR is below price, and MACD remains positive. However, RSI is overbought, so volatility and sharp pullbacks are possible.
🎯 NEXT 3 DAYS The key battle is 1,698. Breakout + confirmation could push price toward 1,772. Rejection may send ZEC back toward 1,500–1,440 liquidity.
⚠️ Risk management is essential. These are technical levels, not guaranteed outcomes. Avoid chasing candles and wait for confirmation.
🔥 VJ ANALYSIS PLAN THE TRADE • MANAGE RISK • CONTROL EMOTIONS #zecusdt
$ZEC is trading around 1,584.59, with price still holding a strong bullish structure on the 3D chart. Momentum remains elevated, but RSI around 80 shows the market is stretched — meaning a pullback can happen before the next major expansion.
📈 TREND: BULLISH
Key resistance: 🔴 R1: 1,698 🔴 R2: 1,772
These are the major upside liquidity areas. A strong breakout and close above 1,698 could open the way toward 1,772+.
🟦 LIQUIDITY / RETEST ZONE 1,440 – 1,500
This is the area to watch if price pulls back. A reaction from this zone could provide a more controlled long setup rather than chasing the current move.
🟢 SUPPORT S1: 1,377 S2: 1,217
As long as price maintains the higher-support structure, the broader trend remains constructive.
🔥 LONG SETUP Entry zone: 1,440–1,500 SL: Below 1,377 TP1: 1,698 TP2: 1,772+
Confirmation: bullish reaction + volume expansion.
⚠️ SHORT SETUP Watch 1,698–1,772 for rejection. Potential targets: 1,500 → 1,377 Invalidation: sustained breakout above the resistance zone.
📊 INDICATORS EMA structure remains bullish, Parabolic SAR is below price, and MACD remains positive. However, RSI is overbought, so volatility and sharp pullbacks are possible.
🎯 NEXT 3 DAYS The key battle is 1,698. Breakout + confirmation could push price toward 1,772. Rejection may send ZEC back toward 1,500–1,440 liquidity.
⚠️ Risk management is essential. These are technical levels, not guaranteed outcomes. Avoid chasing candles and wait for confirmation.
🔥 VJ ANALYSIS PLAN THE TRADE • MANAGE RISK • CONTROL EMOTIONS #zecusdt