


$QNT 📊 QNT/USDT Technical Analysis
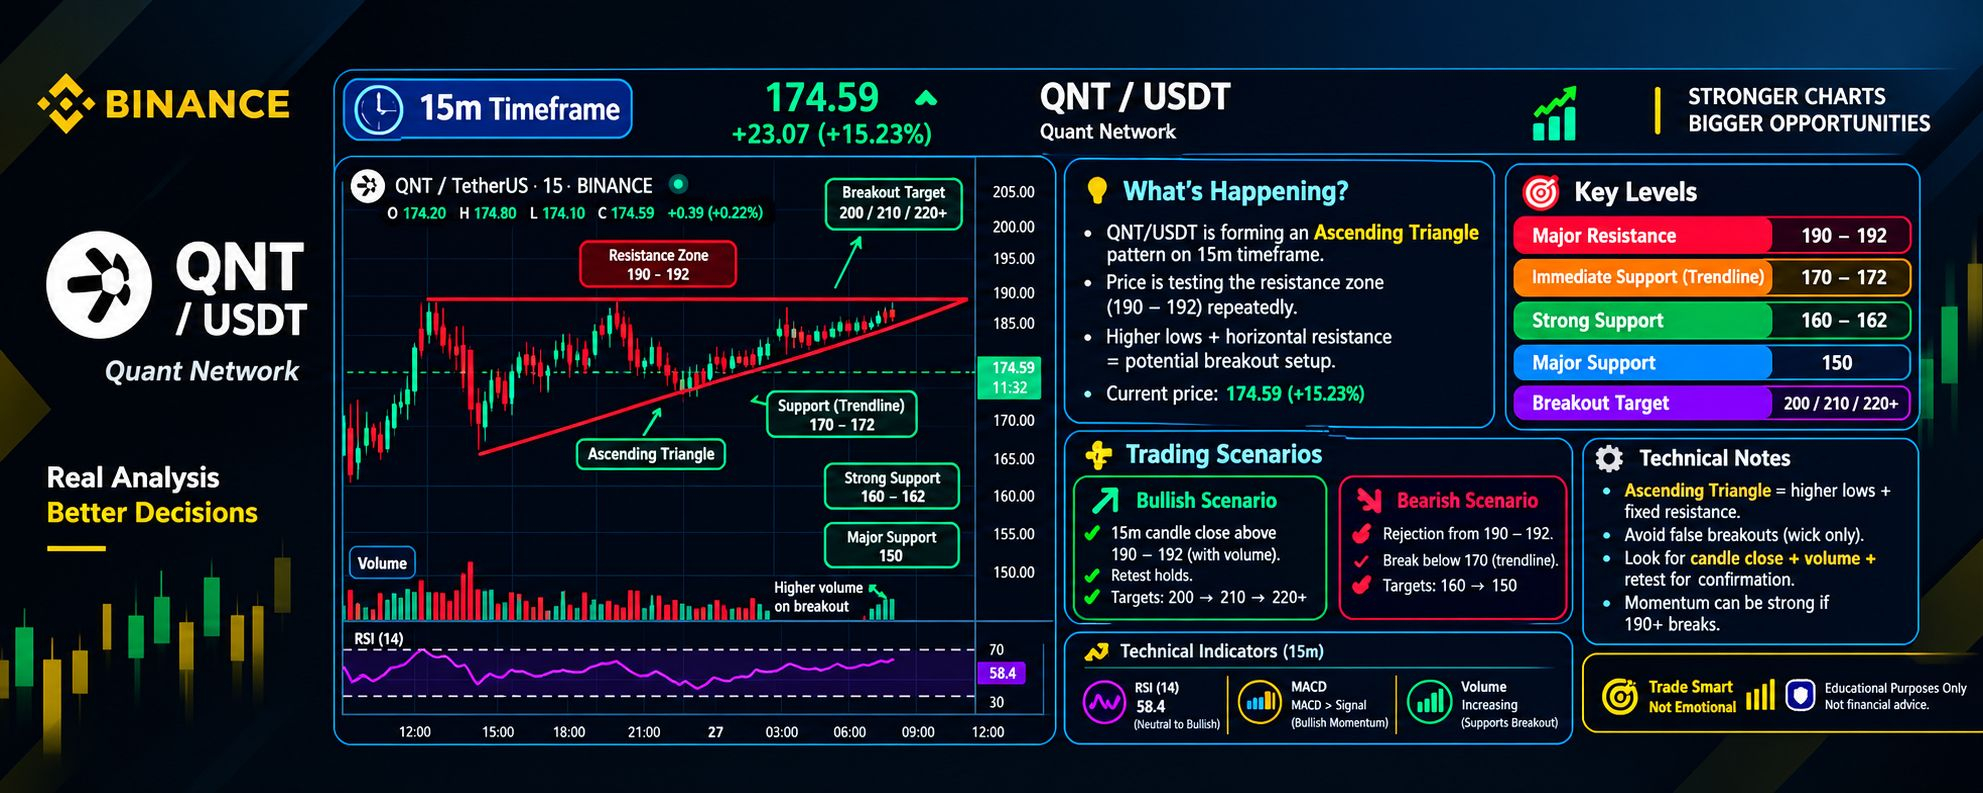
Chart ke mutabiq QNT/USDT mein clear Ascending Triangle structure nazar aa raha hai. Price higher lows bana raha hai, jabke 190–192 USDT ke area mein horizontal resistance repeatedly test ho rahi hai.
🔍 Key Levels
🔴 Major Resistance: 190–192
🟢 Immediate Support: 170–172 trendline
🟢 Strong Support: 160–162
🟢 Major Lower Support: 150
🎯 Breakout Area: 190+ with strong volume
📈 Bullish Scenario
Agar 15m/1H candle 190–192 ke upar strong volume ke sath close karti hai aur retest hold hota hai, to next areas: 200 → 210 → 220+
📉 Bearish Scenario
Agar 190–192 se rejection milti hai aur rising trendline 170 ke neeche decisively break hoti hai, to: 160 → 150 zones important ho sakte hain.
🧠 Technical Structure
Ascending Triangle = higher lows + relatively fixed resistance.
Isliye breakout confirmation ke liye sirf wick nahi, candle close + volume + retest ko dekhna zyada useful hai.
🚀 Binance Square
Title
QNT Price Analysis 🚀 | QNT/USDT Ascending Triangle Breakout Setup | Key Levels & Targets
Description
QNT/USDT technical analysis: Quant is forming an Ascending Triangle pattern with key resistance around $190–$192 and rising support near $170–$172. A confirmed breakout above resistance with strong volume could bring $200, $210 and higher levels into focus, while a breakdown below the rising support could shift attention toward $160–$150.
This analysis covers QNT price action, support & resistance, breakout levels, bullish and bearish scenarios, and QNT trading setup.
🔥 Hashtags
#QNT #QNTUSDT #Quant #QuantNetwork #CryptoAnalysis #TechnicalAnalysis #QNTPrice #CryptoTrading #Altcoins #BinanceSquare
🔑 Keywords
QNT price analysis, QNT USDT analysis, QNT technical analysis, QNT price prediction, Quant crypto analysis, QNT breakout, QNT ascending triangle, QNT support resistance, QNT trading setup, QNT price target, Quant Network, QNT bullish setup
⚠️ Educational analysis only: breakout/rejection confirmation zaroori hai; koi target guaranteed nahi hai.